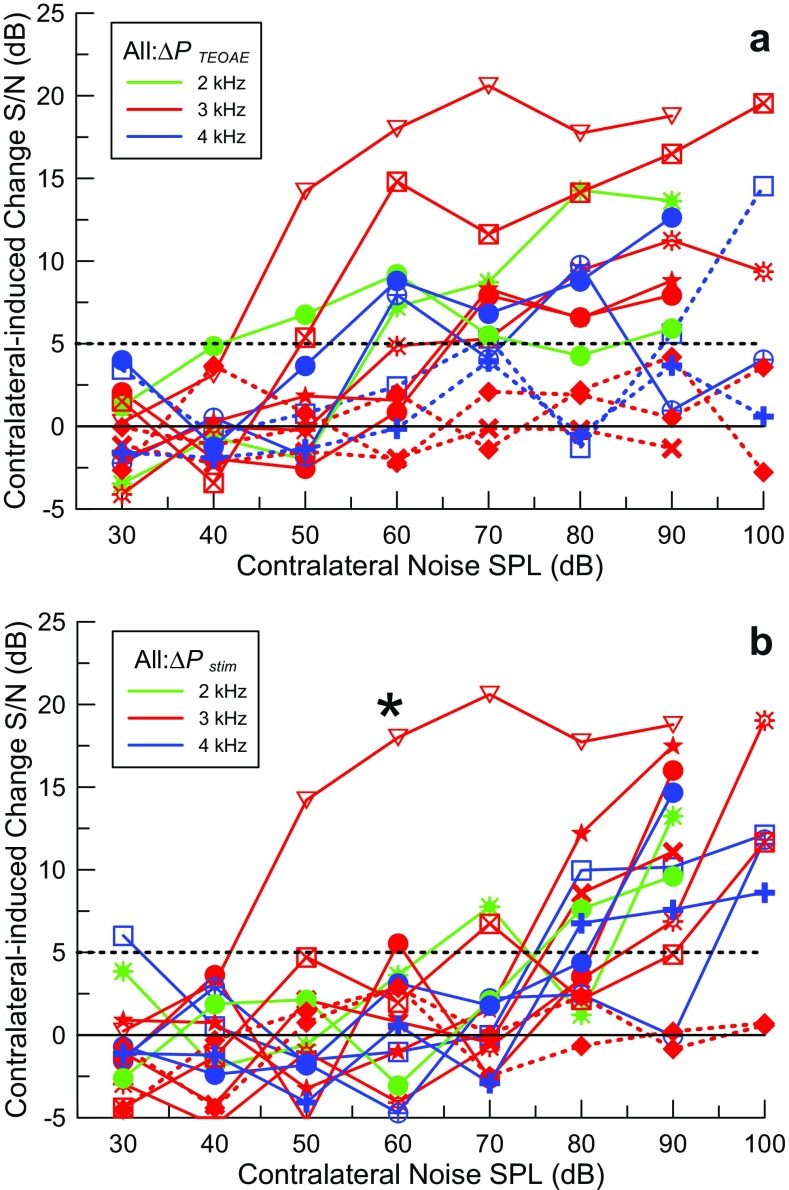
FIG. 7.
Changes in S/N in all subjects for a ΔP TEOAE (MOCR) and b ΔP stim (MEMR) induced by contralateral noise coded by color for different probe frequencies with different symbols for each subject. The colored dashed curves show cases where the pressure change did not reach threshold (indicated with the black dashed horizontal line) for any level of contralateral noise. The plot marked with a star symbol in b is a case where synchronized spontaneous emissions contaminated the stimulus interval and it was not possible to measure the MEMR activation.

