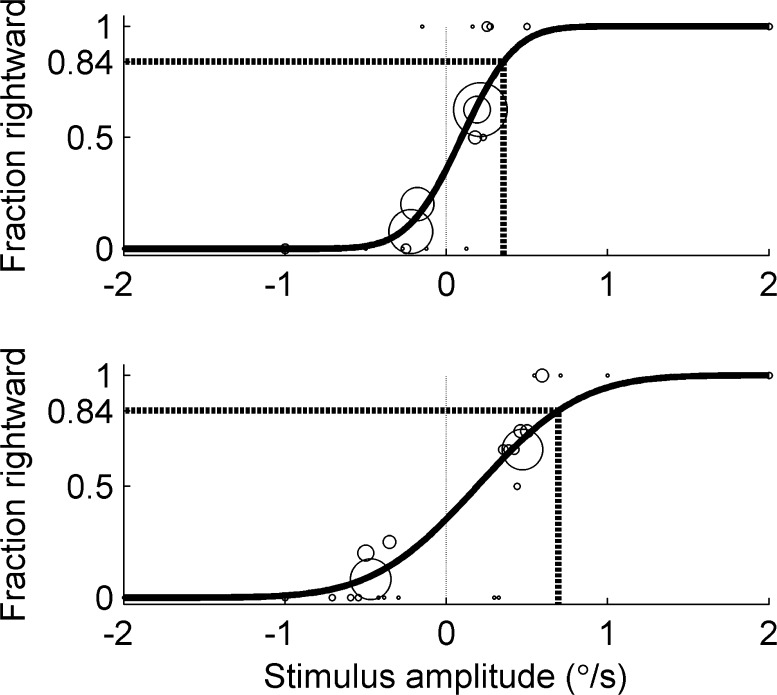
FIG. 3.
Example of subject responses fit with Gaussian cumulative distribution psychometric functions for roll tilt testing from one subject (top: placebo; bottom: promethazine). Circles represent the fraction rightward out of all responses at a given amplitude, where the size of the circle indicates the number of responses. In some cases, responses for stimuli within a 0.03 °/s interval were pooled for display only, but not for fitting analysis. The dashed line indicates the level where the subject perceived 84 % of the motions to be rightward, which is equal to the one-standard-deviation threshold after adjusting for the mean. These results show that, for this particular subject, promethazine increased the standard deviation and, therefore, the roll tilt threshold.

