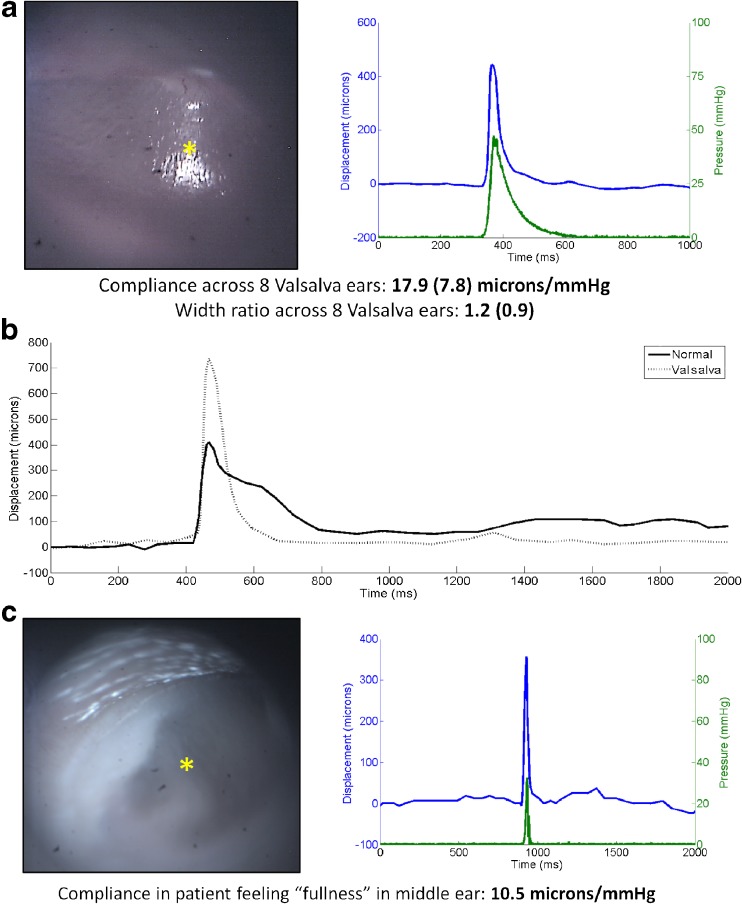
FIG. 6.
Valsalva maneuver. a Otoscopy image (left) and pressure/displacement curves (right) of a representative normal ear while performing the Valsalva maneuver. The mean compliance across 8 Valsalva ears was nearly 18 μm/mmHg. This is 3 times larger than that seen in normal ears. b Displacement of a healthy TM while under normal conditions (solid line) and while under the Valsalva maneuver (dotted line). Stimulus in each case was identical. Larger displacements and faster response times can be seen while under Valsalva. c Otoscopy image (left) and pressure/displacement curves (right) of a subject that complained of “fullness” in their ear. The compliance for this subject was repeatedly measured at ~10 μm/mmHg, much higher than normal and very close to the expected response of an ear under the Valsalva maneuver.

