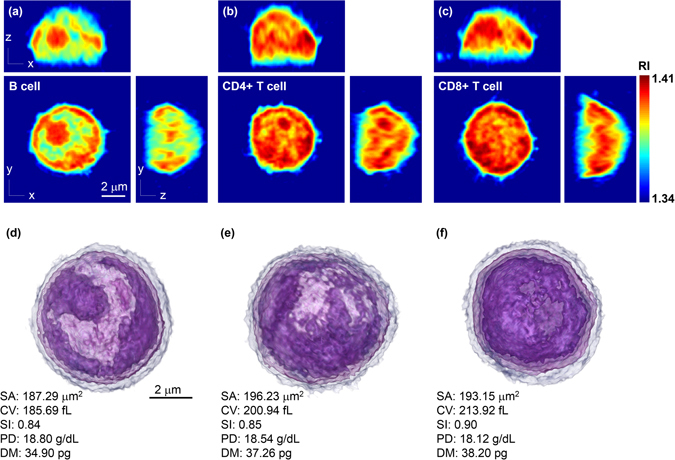
Figure 2.

Representative 3-D RI tomograms of each lymphocyte cell type and the 3-D rendered images with quantitative characterization. Cross-sectional slices of a RI tomogram of (a) B cell, (b) CD4+ T cell, and (c) CD8+ T cell. Scale bar, 2 μm. (d–f) 3-D rendered tomograms and quantitative characterization of the morphological and biochemical features of (a–c). Scale bar, 2 μm. SA, surface area; CV, cellular volume; SI, sphericity; PD, protein density; DM, dry mass.
