Figure 5.

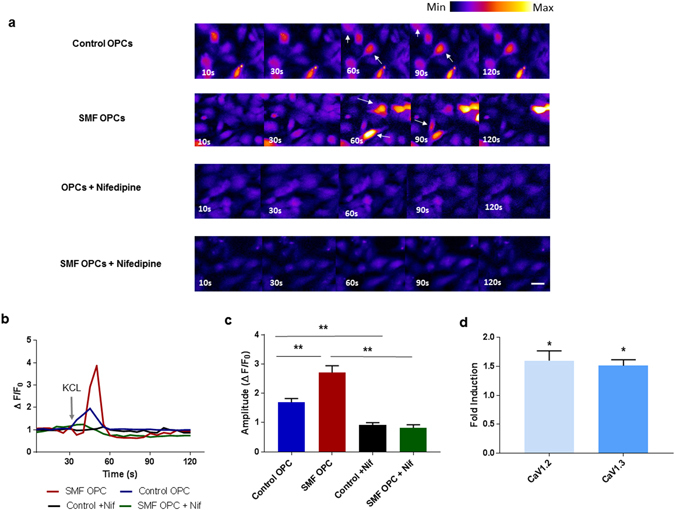
SMF effects on intracellular calcium levels and L-type channel subunits. (a) Representative scans from the time-lapse calcium imaging experiments showing some responding cells (white arrows) post KCL stimulation at 30 seconds, (b) Representative calcium response traces, grey arrow represents the KCL stimulation at 30 sec (c) Summary data showing significantly higher calcium transient amplitudes in SMF stimulated OPCs (n = 12 cells), (d) Quantification of mRNA expression levels of CaV1.2 and CaV1.3 in SMF stimulated OPCs as compared to control OPCs. Scale bar = 20 µm. *p < 0.05, **p < 0.01. Error bars indicate SEM.
