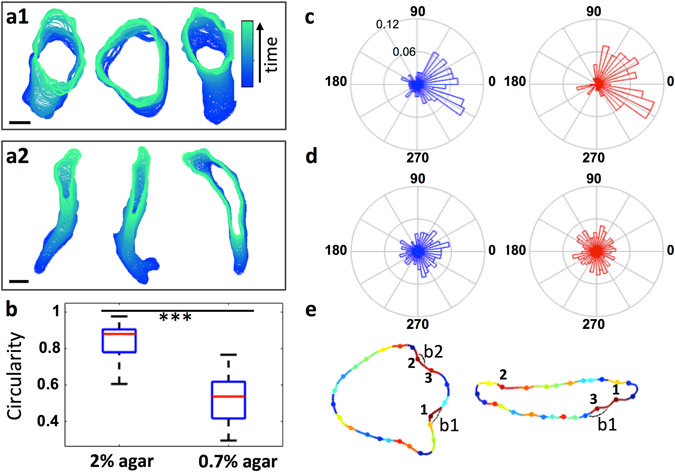
Figure 3.

Observed front-rear gradients in blebbing are predicted by the original model for cells under 2% agarose, where blebs are suppressed at the round cell rear. In elongated cells under 0.7% agarose additional mechanisms are required. Contours of cells migrating under 2% agarose cells are rounder (a1), under 0.7% agarose more elongated (a2), with differences in circularity being significant (b) Mann Whitney U-test, p value < 0.001. (c) Polar histograms of the angular position of experimentally observed bleb nucleation sites around the cell contour, for both 2% agarose (blue) and 0.7% agarose (red), confirm that blebs are more frequently observed in the front half of the cell (74% of all blebs observed under 2% agarose are seen to be confined to the front half of the cells, and 88% under 0.7% agarose). Note that we define the 0°–180° axis to be the direction of the chemotactic gradient, with 0° corresponding to the front of the cell. (d) Polar histograms of the top 3 likely bleb sites predicted by the model for both agarose datasets. The original model based on geometry alone is sufficient to generate a gradient in blebbing activity under 2% agarose (blue), with blebbing suppressed at the round cell rear (we obtain an assymetric distribution of blebbing events spatially, with 63.4% of blebs in the front). Under 0.7% agarose (red), however, the distribution of blebbing events is spatially homogeneous (50.3% of the nucleation sites at the front), suggesting additional mechanisms to direct blebs to the front. (e) Representative model outputs for a cell under 2% agarose (left) and 0.7% agarose (right) demonstrating this effect: Under 2% agarose the 3 most likely (red) regions are at the front. Under 0.7% agarose red labelled regions can be also seen at the cell rear, contrary to what we observe experimentally.
