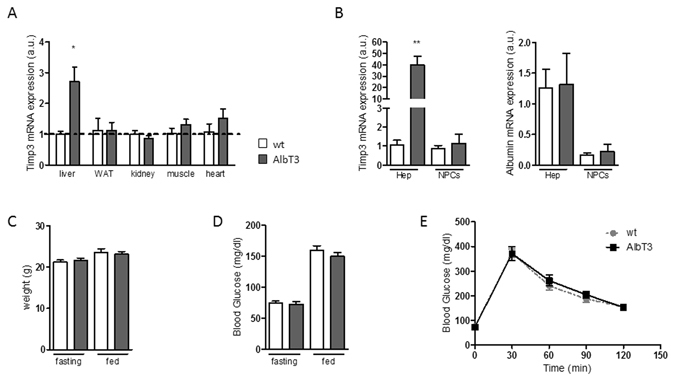
Figure 1.

Generation and characterization of AlbT3 transgenic mice. (A) Relative amount of Timp3 mRNA expression in liver, WAT (with adipose tissue), kidney, muscle and heart of wild-type (wt) and AlbT3 mice. (B) TIMP3 and albumin (hepatocyte marker) mRNA expression in purified hepatocytes (Hep) and non-parenchymal cells (NPCs) from AlbT3 and wt mouse livers. Expression of mRNA was determined by qRT-PCR and values normalized to the endogenous control (β-actin). (n = 3 per group, *p < 0.03, **p < 0.01, Student’s t test, data are means ± SEM). (C) Weight and (D) blood glucose concentration. (E) Intraperitoneal glucose tolerance test (IPGTT). (n = 14 per group, data are means ± SEM). a.u.: arbitrary units.
