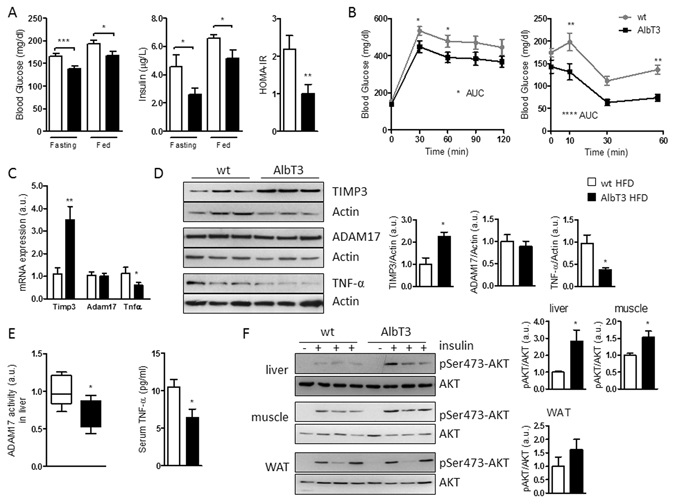
Figure 2.

Metabolic effect in AlbT3 mice after 16 weeks of high-fat diet (HFD). (A) glucose (n = 20 per group); insulin levels and HOMA-IR (n = 8 per group). (B) IPGTT and intraperitoneal insulin tolerance test (IPITT) (n = 13 per group). (C) Timp3, Adam17 and Tnf-α mRNA expression (normalized to β-actin) and (D) TIMP3, ADAM17 and TNF-α protein levels in livers of AlbT3 and wt mice. (E) ADAM17 activity in livers and TNF-α levels in serum of wt and AlbT3 (n = 7 per group). (F) Akt phosphorylation (pSer473-Akt) in liver, skeletal muscle and WAT (n = 5 per group). A representative cropped image of 3 mice per group is shown. (*p < 0.05, **p ≤ 0.02, ***p ≤ 0.005, ****p < 0.002; Student’s t test, data are means ± SEM). AUC: area under the curve.
