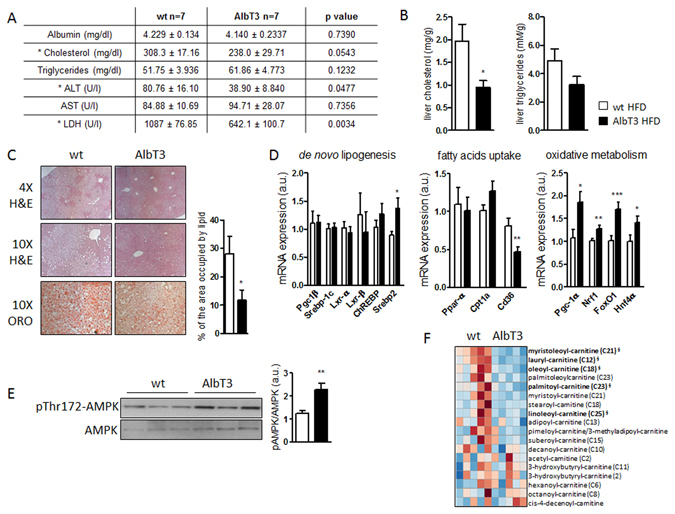
Figure 3.

Reduced hepatic steatosis and cholesterol content in wt and AlbT3 mice after 16 weeks of HFD. (A) Serum biochemical analytes. ALT: alanine transaminase; AST: aspartate transaminase; LDH: lactate dehydrogenase (p values are shown). (B) Liver cholesterol and triglycerides content. (C) Representative pictures (×4 and ×10 magnification) of liver stained with hematoxylin/eosin (H&E) and Oil Red O (ORO). Quantification of the area occupied by lipid in ORO staining. (D) Liver mRNA expression of genes involved in de novo lipogenesis, fatty acids uptake and oxidative metabolism. (normalized to β-actin). (E) Representative cropped image of Western blots for AMPKα phosphorylation (pThr172-AMPKα) in liver extract. (n = 7 per group; *p < 0.05, **p ≤ 0.02, ***p ≤ 0.005; Student’s t test, data are means ± SEM). (F) Heatmap of acyl-carnitines in serum. Regions of red or blue indicate that the metabolite content is increased or decreased, respectively (n = 5; §indicates significant difference with p ≤ 0.05 between the groups, metabolite ratio of <1.00; Welch’s Two-Sample t-Test).
