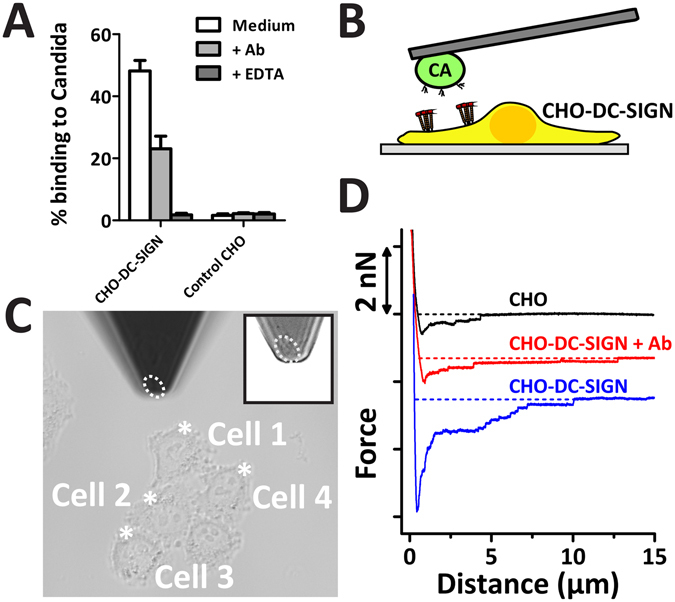
Figure 3.

AFM-assisted cell-cell force spectroscopy to measure the interaction strength of single CHO-DC-SIGN cells and C. albicans. (A) Parental CHO cells and cells expressing DC-SIGN-WT were incubated with FITC-labeled C. albicans in the presence or absence of blocking agents; anti-DC-SIGN antibody and EDTA. The percentage of cells that bound C. albicans was calculated by flow cytometry. Data are presented as means ± S.D. (B) Schematic set-up showing a single C. albicans cell immobilized on a tip-less AFM cantilever interacting with a CHO-DC-SIGN cell. (C) Example brightfield image that shows how a C. albicans cell on the tip (indicating by dashed white ellipse) is positioned to interact with four different CHO-DC-SIGN cells. The positions at which the C. albicans is brought into contact are indicated by asterisks. (D) Example FD-curves of C. albicans interacting with parental CHO, CHO-DC-SIGN-WT with addition of 30 µg/ml anti-DC-SIGN blocking antibody for 30 minutes.
