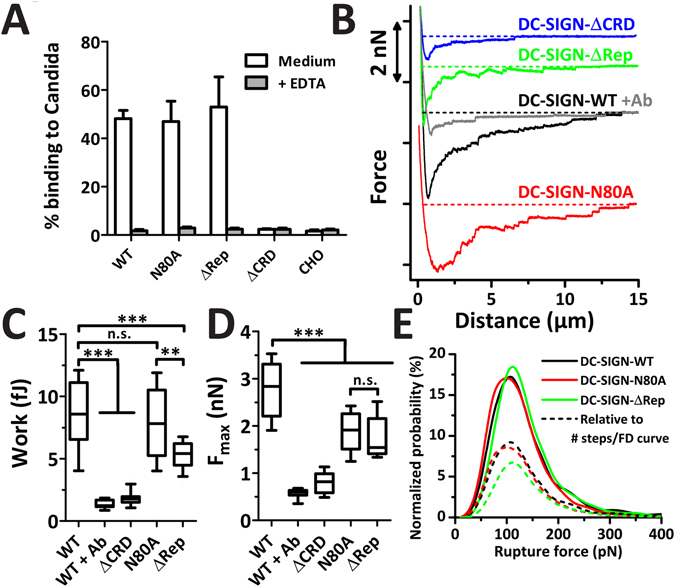
Figure 4.

Contribution of the different domains of DC-SIGN to the interaction with C. albicans. (A) CHO cells expressing the different DC-SIGN mutants were incubated with FITC-labeled C. albicans cells in the presence or absence of EDTA. The percentage of cells that bound C. albicans was calculated by flow cytometry. Data are presented as means ± S.D. (B) Example FD-curves of C. albicans interacting with CHO-DC-SIGN-WT with and without blocking Ab, CHO-DC-SIGN-ΔCRD, CHO-DC-SIGN-N80A, or CHO-DC-SIGN-ΔRep cells. (C,D) The detachment force (C) and work (D) needed to detach an C. albicans cell from the CHO cells stably expressing DC-SIGN-WT before and after blocking by anti-DC-SIGN, and CHO cells stably expressing DC-SIGN-ΔCRD, DC-SIGN-N80A, or DC-SIGN-ΔRep (N ≥ 3 independent experiments; N ≥ 20 cells; N ≥ 20 FD-curves per condition). Significance levels by Mann-Whitney (n.s. = not significant; **p<0.01; ***p<0.001). (E) Probability distribution of all rupture steps detected in the FD-curves of DC-SIGN-WT, DC-SIGN-N80A, and DC-SIGN-∆Rep interacting with C. albicans show different distributions that all peak around 110 pN (N > 2000 rupture steps). The normalized probability plots are shown and the ‘dashed’ curves are scaled relative to the number of rupture steps per FD-curve (arbitrary units).
