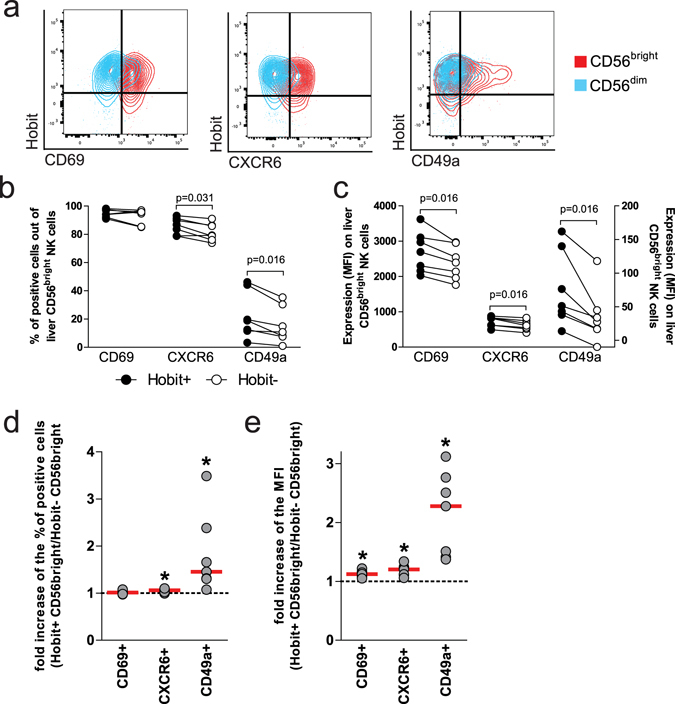
Figure 3.

Hobitpos CD56bright liver NK cells express high levels of markers related to tissue residency. (a) Contour plots showing expression CD69 (left plot), CXCR6 (middle plot) and CD49a (right plot) compared to Hobit on CD56bright (red) and CD56dim (blue) NK cells in the liver. Frequency (b) and expression levels (c) of CD69, CXCR6 and CD49a comparing Hobitpos (full symbols) to Hobitneg (open symbols) CD56bright NK cells from the liver. (d) Fold change (left panel) of CD69-, CXCR6- and CD49a-positive CD56bright liver NK cells comparing Hobitpos to Hobitneg cells. (e) Fold increase of the MFI (right panel) of CD69, CXCR6 and CD49a on CD56bright liver NK cells comparing Hobitpos with Hobitneg cells. Wilcoxon matched pair sign rank test was used to determine statistical differences in the scatter plots.
