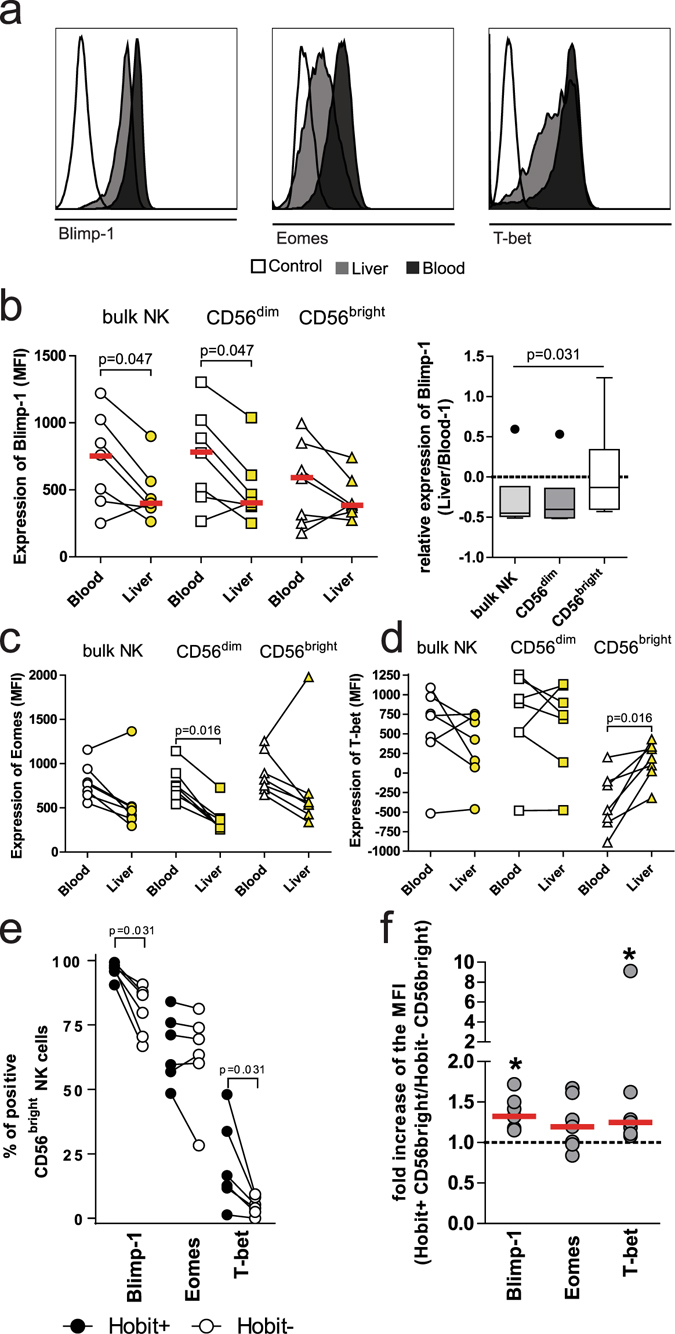
Figure 4.

Altered expression of transcriptions factors in Hobitpos CD56bright liver NK cells. (a) Histogram showing expression of Blimp-1 (left panel), Eomes (middle panel) and T-bet (right panel) on bulk NK cells in the blood (dark grey) compared to the liver (light grey) and a FMO control (white). (b) Expression (left panel) of Blimp-1 on bulk, CD56dim and CD56bright NK cells in the peripheral blood (open symbols) and liver (yellow symbols). Ratio of the expression (right panel) of Blimp-1 in each subset between Liver and Blood. (c) Expression of Eomes on bulk, CD56dim and CD56bright NK cells in the blood (open symbols) and liver (yellow symbols). (d) Expression of T-bet on bulk, CD56dim and CD56bright NK cells in the blood (open symbols) and liver (yellow symbols). (e) Frequency of Blimp-1pos, Eomespos and T-betpos cells among CD56bright liver NK cells comparing Hobitpos (black symbol) with Hobitneg (open symbol). (f) Fold change of the expression (MFI) of Blimp-1, Eomes and T-bet on CD56bright liver NK cells comparing Hobitpos with Hobitneg cells. Wilcoxon matched pair sign rank test was used to determine statistical differences in the scatter plots and Friedman test was used for box plots.
