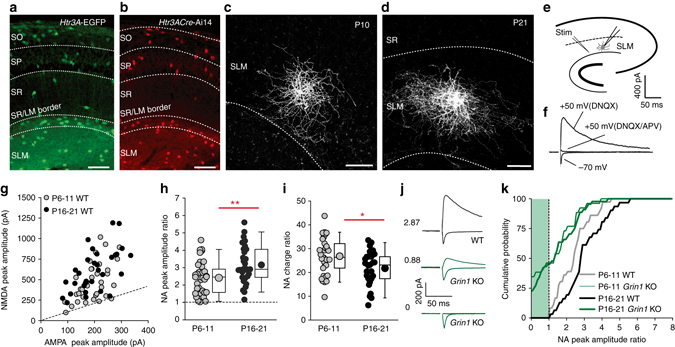
Fig. 1.

Postnatal developmental regulation and functional knockdown of NMDAR-mediated synaptic input onto CGE-derived NGFCs. a, b Confocal images of CA1 regions of hippocampi from Htr3A-EGFP and Htr3A-cre:Ai14 mice illustrating the lamina distribution of CGE-derived INs. Scale bars, 100 μm. c, d Confocal images of biocytin-filled SLM interneuron targeting using the reporter mice with NGFC morphology at P10 and P21 developmental time points. Scale bars, 50 μm. e Schematic depicting the recording configuration and stimulus (stim) employed to evoke glutamatergic synaptic input. f Representative example of a whole-cell voltage-clamp recording from the NGFC illustrated in d illustrating AMPAR and NMDAR-mediated EPSCs in response to SLM afferent stimulation. g Scatterplot of AMPAR- and NMDAR-mediated EPSC peak amplitudes in individual SLM NGFCs targeted using the Htr3A-cre:Ai14 mouse (referred subsequently as simply WT) at two developmental stages P6-11 (gray circles; n = 36) and P16-21 (black circles; n = 31). h NMDAR/AMPAR (NA) peak amplitude ratios in NGFCs at P6-11 (gray circles; n = 36) vs. P16-21 (black circles; n = 31). i NA charge ratio at P6-11 (gray circles; n = 36) vs. P16-21 (black circles; n = 31). j Single trace examples of NMDAR and AMPAR EPSCs in individual NGFCs in WT (black traces) and Htr3A-cre:Ai14:Grin1flox/flox mouse lines (referred hereafter as Grin1 KO; green traces). Values denote NA peak amplitude ratio in each individual cell. k Cumulative distribution of NA peak amplitude ratios in WT (black lines; n = 31 and 36 for P6-11 and P16-21, respectively) and Grin1 KO (green lines; n = 26 and 46 for P6-11 and P16-21, respectively). Dotted lines in g, h and green shaded box in k denotes NA peak amplitude ratios of 1 or lower. Mann–Whitney U-tests were used for all comparisons (*p < 0.05, **p < 0.01, ***p < 0.001). CGE caudal ganglionic eminence, SLM stratum laconosum moleculare, SO stratum oriens, SP stratum pyramidale, SR stratum radiatum. All n values correspond to the number of cells recorded. Construction of box-whisker plots is detailed in methods
