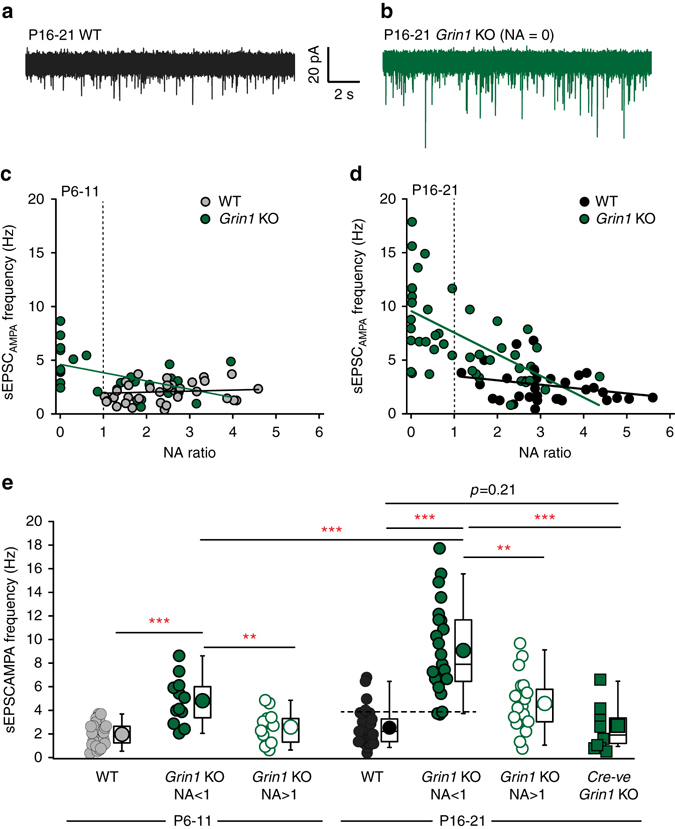
Fig. 2.

NMDAR-hypofunction precipitates an abnormal increase in sEPSCAMPA frequency in CGE-derived NGFCs. a, b Gap-free voltage-clamp traces illustrating sEPSCAMPA events recorded from a putative SLM NGFC in WT (black trace) and Grin1 KO (green trace) mouse. c, d Scatterplots illustrating the relationship between NA ratio and sEPSCAMPA frequency in individual CGE NGFCs from WT (gray and black circles; n = 35, 30 for P6-11 and P16-21, respectively) and Grin1 KO mice (green circle; n = 26, 43 for P6-11 and P16-21, respectively). e sEPSCAMPA frequency onto CGE NGFCs in WT (gray and black circles; n = 35, 30 for P6-11 and P16-21, respectively) and Grin1 KO mice (binned according to NA ratio; filled green circles for NA < 1 and n = 12, 23 at P6-11 and P16-21, respectively; open green circles for NA > 1 and n = 14, 20 at P6-11 and P16-21, respectively). Green filled squares denote sEPSCAMPA frequency measured in cre-negative cells in P16-21 Grin1 KO mice (n = 10). Mann–Whitney U-tests were used for all comparisons (**p < 0.01, ***p < 0.001). All n values correspond to the number of cells recorded. Construction of box-whisker plots is detailed in methods. Dotted line in e indicates sEPSC frequency > 4 for virtually all CGE NGFCs with NMDAR-hypofunction
