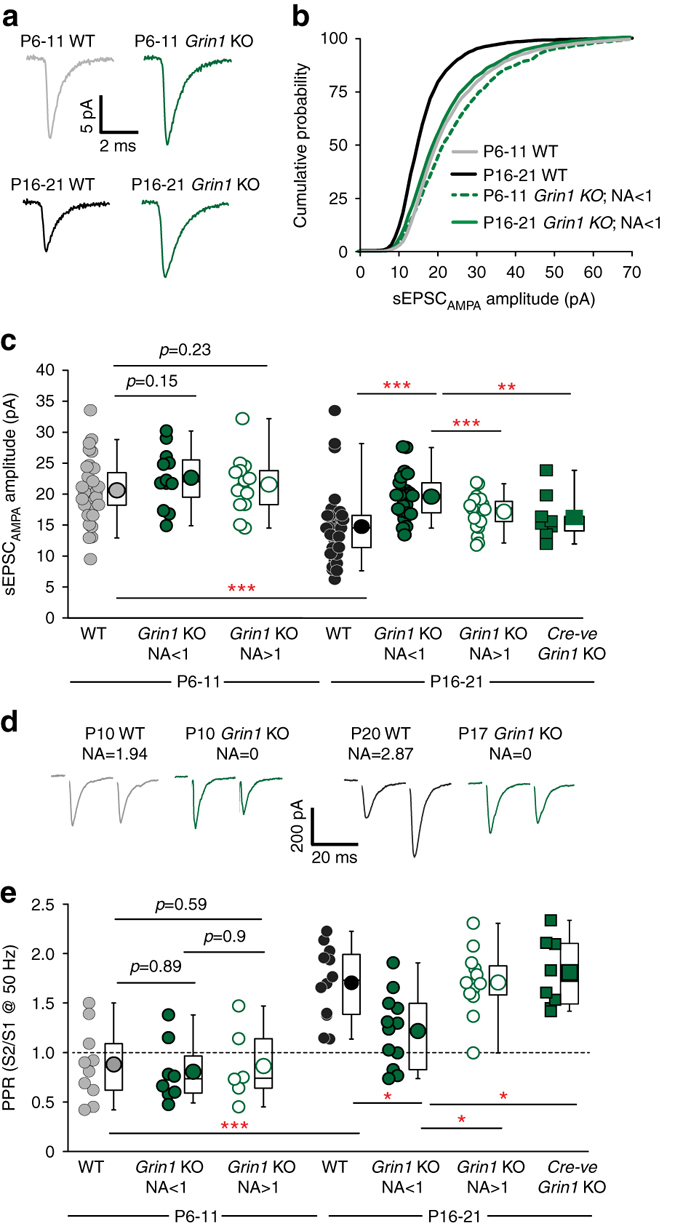
Fig. 3.

NMDAR-hypofunction retards normal postnatal development of sEPSCAMPA and SLM afferent evoked paired pulse ratio on CGE-derived NGFCs. a Ensemble averages of sEPSCAMPA events in WT (gray and black traces) and Grin1 KO (green traces) CGE NGFCs at P6-11 and P16-21. b Cumulative distribution curves of sEPSCAMPA amplitude in WT (gray and black lines; n = 36, 31 for P6-11 and P16-21, respectively) and Grin1 KO (dotted and solid green lines; n = 12, 22 for P6-11 and P16-21, respectively) mice. c Pooled data of mean sEPSCAMPA amplitudes measured in CGE NGFCs from WT (gray and black circles; n = 36, 31 for P6-11 and P16-21, respectively) and Grin1 KO mice (binned according to NA ratio; filled green circles for NA < 1 and n = 12, 22 at P6-11 and P16-21, respectively; open green circles for NA > 1 and n = 13, 23 at P6-11 and P16-21, respectively). Green filled squares denote sEPSCAMPA amplitude measured in cre-negative cells in P16-21 Grin1 KO mice (n = 10). (d) Single trace examples of evoked AMPAR-mediated EPSCs following paired pulse stimulation (50 Hz) of SLM afferent fibers in WT (gray and black traces) and Grin1 KO mice (green) at p6-11 and p16-21. Corresponding ages and NA ratio in each NGFC is indicated above traces. e Paired pulse ratio (PPR) in WT (gray and black circles; n = 10, 12 for P6-11 and P16-21, respectively) and Grin1 KO mice (binned according to NA ratio; filled green circles for NA < 1 and n = 8, 12 at P6-11 and P16-21, respectively; open green circles for NA > 1 and n = 6, 13 at P6-11 and P16-21, respectively). Green filled squares denote PPR measured in cre-negative cells in P16-21 Grin1 KO mice (n = 8). Mann–Whitney U-tests were used for all comparisons (**p < 0.01, ***p < 0.001). All n values correspond to the number of cells recorded. Construction of box-whisker plots is detailed in methods
