Fig. 4.

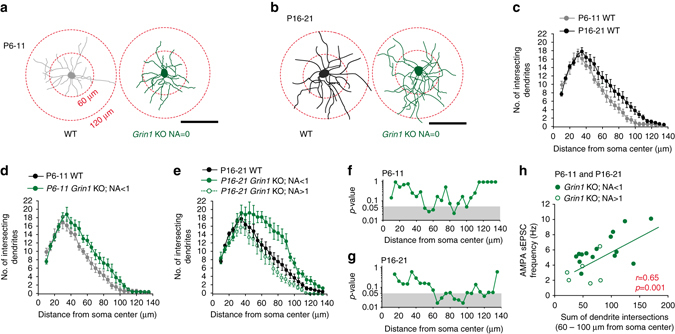
NMDAR-hypofunction induces an increased dendrite complexity of CGE-derived NGFCs during postnatal development. a, b Single cell examples of the dendritic arborization of WT (gray and black cells; P6-11 and P16-21, respectively) and Grin1 KO (green cells) CGE NGFCs. Examples of concentric circles employed for subsequent Sholl analyses (red circles). Scale bars, 100 μm. c Sholl analyses plots of total number of dendrites intersecting each concentric circle (0–135 μm from center of soma every 5 μm) in P6-11 (gray data; n = 7) and P16-21 (black data; n = 15) WT CGE NGFCs. d Sholl analyses plots comparing morphology of P6-11 WT (gray data; n = 7) and Grin1 KO (green data; NA < 1; n = 6) CGE NGFCS. Note, P6-11 WT data (gray) in this panel is re-plotted from c. e Sholl analyses plots comparing morphology of P16-21 WT (black data; n = 15) and Grin1 KO CGE NGFCS (green data; filled vs. open circles denote data from NGFCs with NA < 1 and NA > 1, respectively; n = 11 and 6). Note, P16-21 WT data (black) in this panel is re-plotted from c. f, g Statistical comparison of the number of intersecting CGE NGFC dendrites at each concentric distance away from cell body between WT and Grin1 KO mice (p-values are derived from Mann–Whitney U-test; Gray shaded area denotes p-values < 0.05). h Correlation of the sum of dendrite intersection (60–100 μm from the soma center) and sEPSCAMPA frequency in individual NGFCs. r and p-values as indicated from straight-line fit statistical analysis demonstrates a significant positive linear correlation between dendrite intersections and sEPSCAMPA frequency. All n values correspond to the number of cells recorded. Error bars denote SEM
