Figure 3.

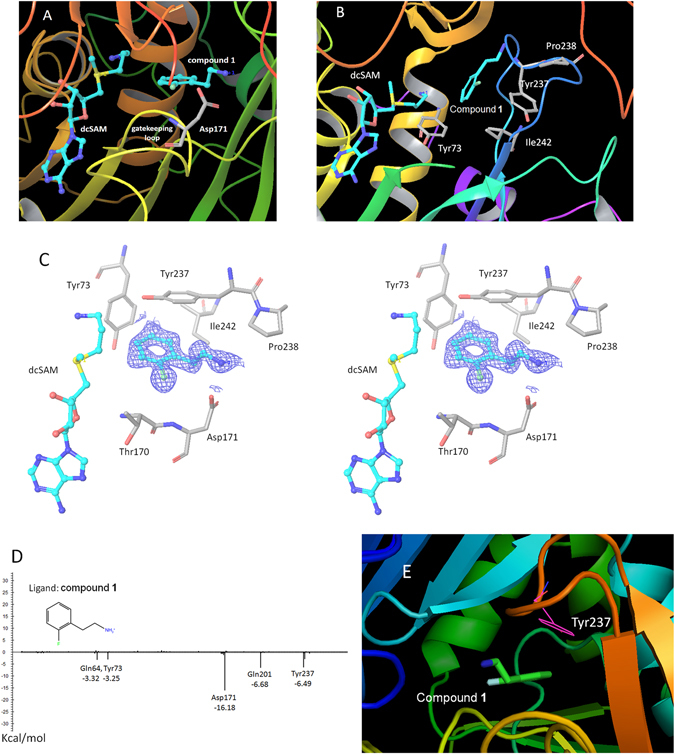
The crystal structure analysis of TcSpdSyn with compound 1. (A) The crystal structure of the TcSpdSyn-compound 1 complex. (B) Binding form of compound 1 predicted by docking simulation. (C) Stereo representation of the TcSpdSyn-compound 1 complex structure. The 2Fo-Fc map around compound 1 is shown as a blue mesh (contoured at 1.5σ). (D) Interaction energy analysis of compound 1. The vertical axis shows the interaction energy (kcal/mol) between the ligand and amino acid, and the horizontal axis shows the amino acid residue number. (E) Interaction between compound 1 and Tyr237.
