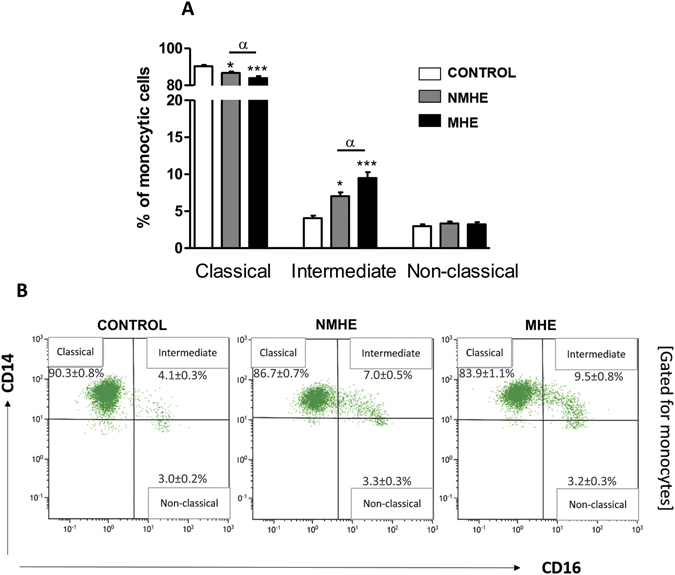
Figure 1.

Monocytes populations in peripheral blood. (A) Percentage of the three subsets of monocytes over total monocyte cells: classical (CD14++CD16−), intermediate (CD14++CD16+) and non-classical (CD14+CD16++). (B) Examples of panels from the cytometer (gated for total monocytes population). Values are the mean ± SEM of the following number of individuals: CONTROL n = 28; without MHE (NMHE) n = 30; with MHE (MHE) n = 40. Values significantly different from controls are indicated by asterisks*. Values significantly different in patients with MHE compared to NMHE are indicated by α. (*/α p < 0.05; ***p < 0.001).
