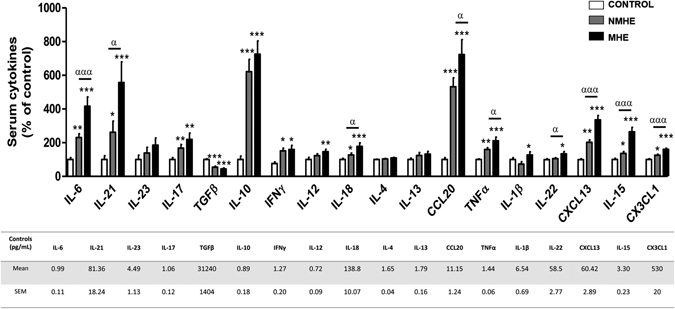
Figure 3.

Serum levels of different cytokines. The serum levels of the indicated cytokines were measured and are expressed as percentage of controls to allow easy identification of alterations in patients without (NMHE) and with (MHE). The concentrations for controls are given in pg/ml in the Table. Values are the mean ± SEM of the following number of individuals: CONTROL n = 40; NMHE n = 50; MHE n = 40. Values significantly different from controls are indicated by asterisks*. Values significantly different in patients with MHE compared to NMHE are indicated by α. (*/αp < 0.05; **p < 0.01; ***/αααp < 0.001).
