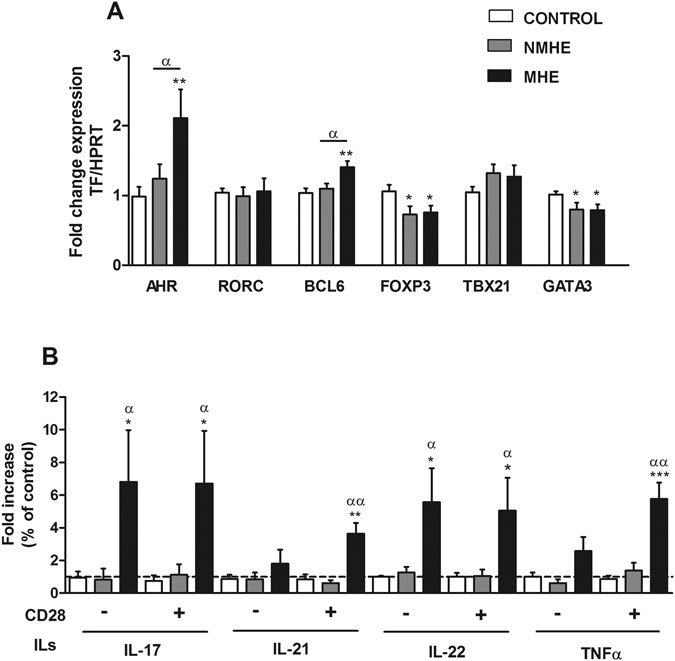
Figure 4.

MHE is associated with expansion of Th follicular and Th22 CD4+ T lymphocytes subsets. (A) Analysis of the expression of the transcription factors AHR, RORC, BCL6, FOXP3, TBX21 and GATA3 mRNA expression in PBMCs. Data represent the normalized target gene amount relative to controls which are considered as 1. Values are the mean ± SEM of the following number of individuals: CONTROL n = 19; without MHE (NMHE) n = 15; with MHE (MHE) n = 15. (B) Analysis of cytokines secreted by isolated CD4+ T cells in vitro in the absence (−) or the presence (+) of added CD28. Values are given as the fold increase of cytokines levels over controls, which are considered as 1. Values are the mean ± SEM of the following number of individuals: CONTROL n = 9; NMHE n = 5; MHE n = 7. Values significantly different from controls are indicated by asterisks*. Values significantly different in patients with MHE compared to NMHE are indicated by α. (*/αp < 0.05; **/ααp < 0.01; ***p < 0.001).
