Figure 5.

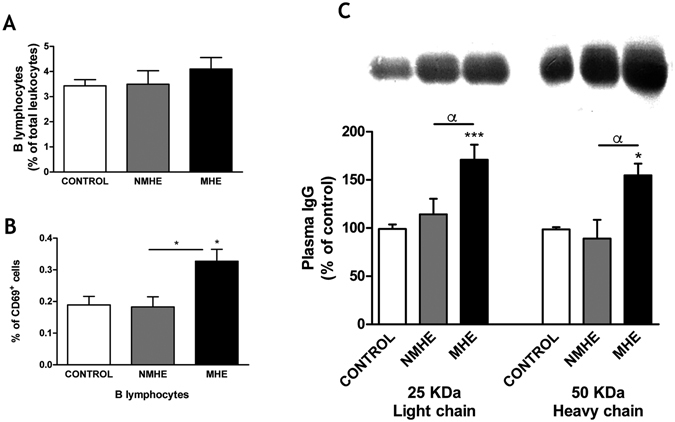
MHE is associated with activation of B lymphocytes and increased IgG content in plasma. (A) Percentage of total leukocytes that are B lymphocytes, as identified by flow cytometry by morphology combined with CD45 and CD19 positively marked cells. (B) Percentage of B lymphocytes that are activated (CD69+). (C) Content of IgG light (25 KDa) and heavy (50 KDa) chains in plasma, analyzed by western blot and expressed as percentage of control subjects. Representative images of the blots are shown. Unprocessed original scan of the blot is shown in Supplementary Fig. 1. Values are the mean ± SEM of the following number of individuals: CONTROL n = 19, without MHE (NMHE) n = 17, with MHE (MHE) n = 22. Values significantly different from controls are indicated by asterisks*. Values significantly different in patients with MHE compared to NMHE are indicated by α. (*/αp < 0.05; ***p < 0.001).
