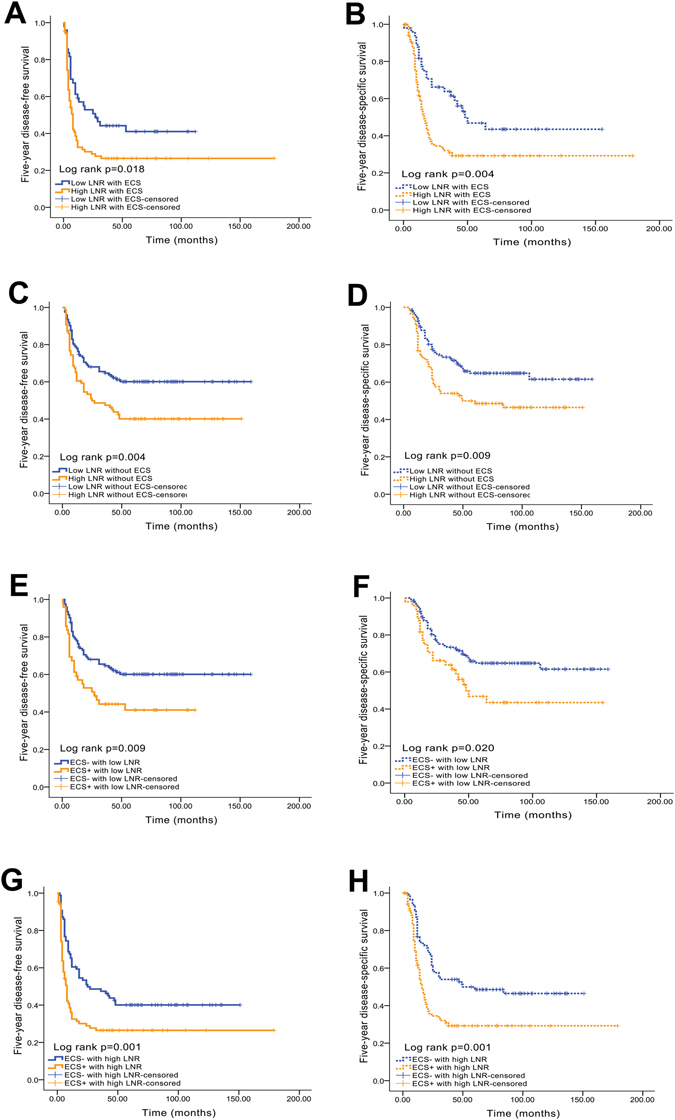
Figure 3.

Kaplan-Meier analyses of 5-year DFS and DSS between the LNR and ECS status. (A) Five-year DFS curve for the LNR in the ECS+ subgroup; (B) 5-year DSS curve for the LNR in the ECS+ subgroup; (C) 5-year DFS curve for the LNR in the ECS− subgroup; (D) 5-year DSS curve for the LNR in the ECS− subgroup; (E) 5-year DFS curve for the ECS status in the low LNR subgroup; (F) 5-year DSS curve for the ECS status in the low LNR subgroup; (G) 5-year DFS curve for the ECS status in the high LNR subgroup; (H) 5-year DSS curve for the ECS status in the high LNR subgroup.
