
Figure 3.
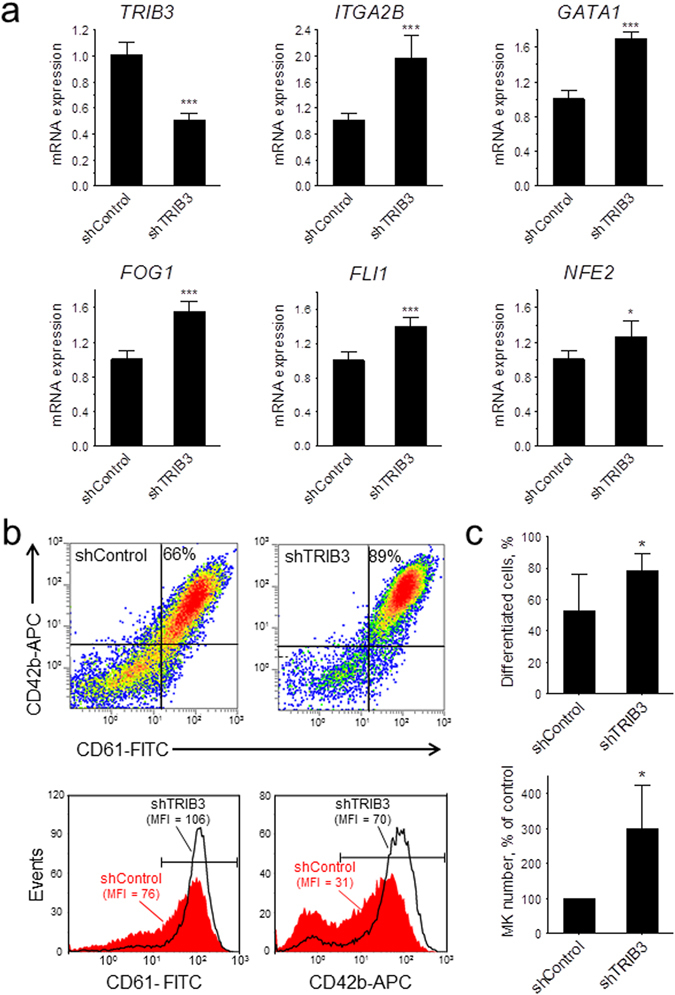
TRIB3 silencing enhances the megakaryocytic differentiation of primary haematopoietic cells. shRNA-transduced cells (shControl and shTRIB3.4) were grown for 7 days with 40 ng/mL TPO and then analysed for mRNA and surface marker expression. (a) mRNA levels for the indicated genes are depicted relative to the respective levels in shControl. Error bars denote SD of pooled Q-PCR data from two independent experiments (n = 6). (b,c) Flow cytometric analysis of megakaryocytic differentiation. (b) Representative density plots display the percentages of differentiated cells and histogram plots display the median fluorescence intensities of the cells encompassed within the horizontal markers. (c) Results of four independent experiments are presented as mean ± SD. The top panel shows the percentages of differentiated cells in the transduced cultures and the bottom panel shows the total number of differentiated cells, expressed as a percentage of those in shControl. *P < 0.05 and ***P < 0.001.