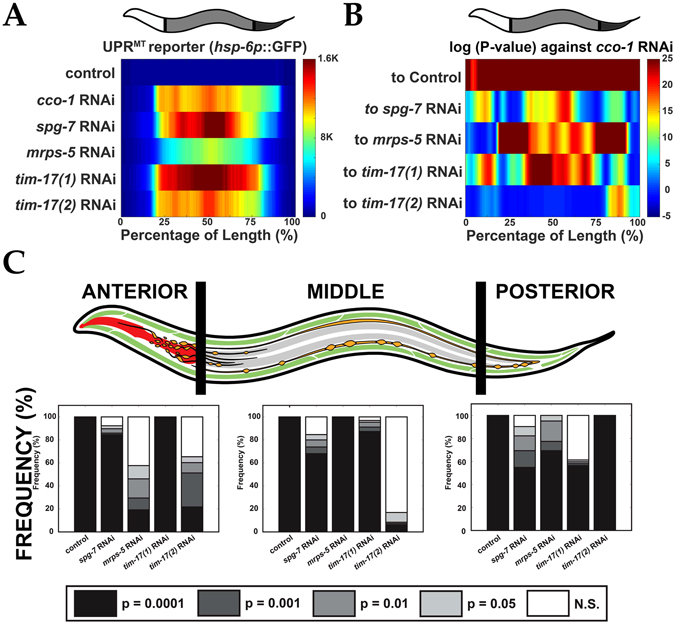
Figure 3.

Longitudinal quantification of transcriptional reporter. (A) Median profiles of UPRmt after induction of the mitochondrial unfolded protein response (UPRmt) by various RNAi treatments. (B) Significance plot (log10(P-value)) derived from median profiles in (A) comparing all profiles to “cco-1 RNAi” (downregulation of Complex I). For significance plots a value ≥ 0 is equivalent to P ≤ 0.05 by Wilcoxon Rank Sum Test. (C) Frequency plots for the percentage of bits in each region of the worm (left) that correspond to varying degrees of significance by Wilcoxon Ran Sum (white = not significant “N.S.”; light grey = P < 0.05; medium grey = P < 0.01; dark grey = P < 0.001; black = P < 0.0001). Comparisons are made for each of these regions against “cco-1 RNAi”. All animals are positioned with the anterior side to the left. Plots are representative of three biological replicates and derived from n ≥ 50 organisms. Sample size (n) for all experiments and exact P-values can be found in the Supplementary Table. L.A. Daniele provided the illustrations.
