Figure 4.

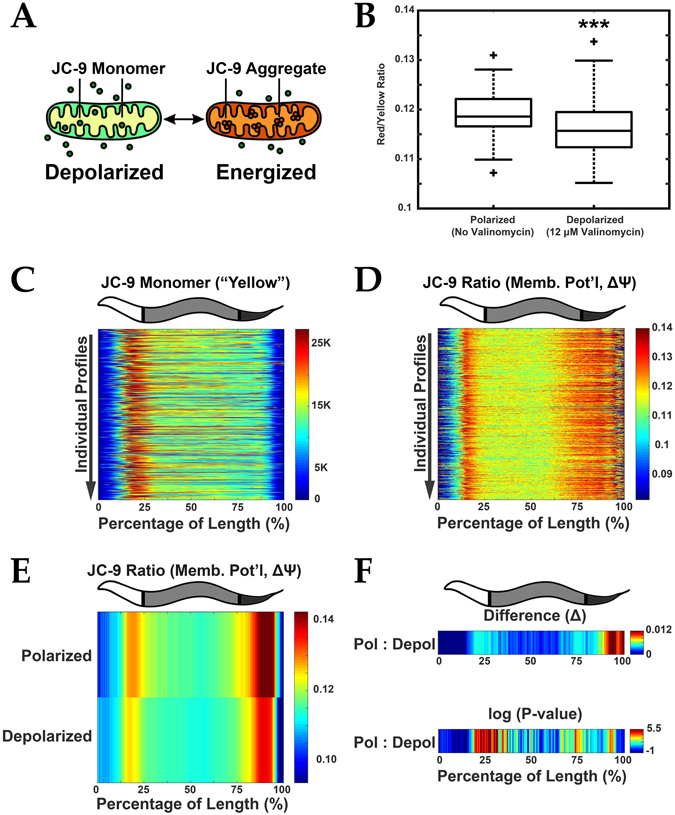
Functional analysis of mitochondrial membrane potential. (A) JC-9 is a mitochondrial (Mito) dye that exists in a monomeric (yellow fluorescent) state but forms red fluorescent aggregates when mitochondria are polarized. Red fluorescence increases relative to an increase in mitochondria membrane potential (Δψ). The ratio of Aggregate (Red) to Monomer (Yellow) signal thus approximates the magnitude of membrane potential. (B) Ratio of Aggregate to Monomer fluorescence decreases upon depolarization with 12 µM valinomycin indicating a reduction in membrane potential (Δψ). ***P < 0.0001. (C) Demonstration of orientation algorithm showing individual profiles (Y axis) represented with signal intensity plotted as a function of the animal’s length (X axis). Yellow (monomeric JC-9) fluorescence is shown which enables orientation in young adult C. elegans. (D) JC-9 ratio (mitochondrial Δψ) for these corresponding profiles is also plotted. Data is shown in a heat map with Red as the most signal and Blue the least. (E) Median profiles from animals in (B) plotting JC-9 (Aggregate/Monomer) ratio when mitochondria are in the polarized and depolarized state. (F) Difference (Δ) plot (top) and significance plot (bottom) derived from median profiles in (E) comparing polarized to depolarized conditions. For significance plots a value ≥ 0 is equivalent to P ≤ 0.05 by Wilcoxon Rank Sum. All animals are positioned with the anterior side to the left. Plots are representative of three biological replicates and derived from n ≥ 50 organisms. Sample size (n) and P-values can be found in the Supplementary Table. L.A. Daniele provided the illustrations for Part A originally published in: Daniele, J. R., Heydari, K., Arriaga, E. A. & Dillin, A. Identification and Characterization of Mitochondrial Subtypes in Caenorhabditis elegans via Analysis of Individual Mitochondria by Flow Cytometry. Anal. Chem. 88, 6309–6316 (2016)11.
