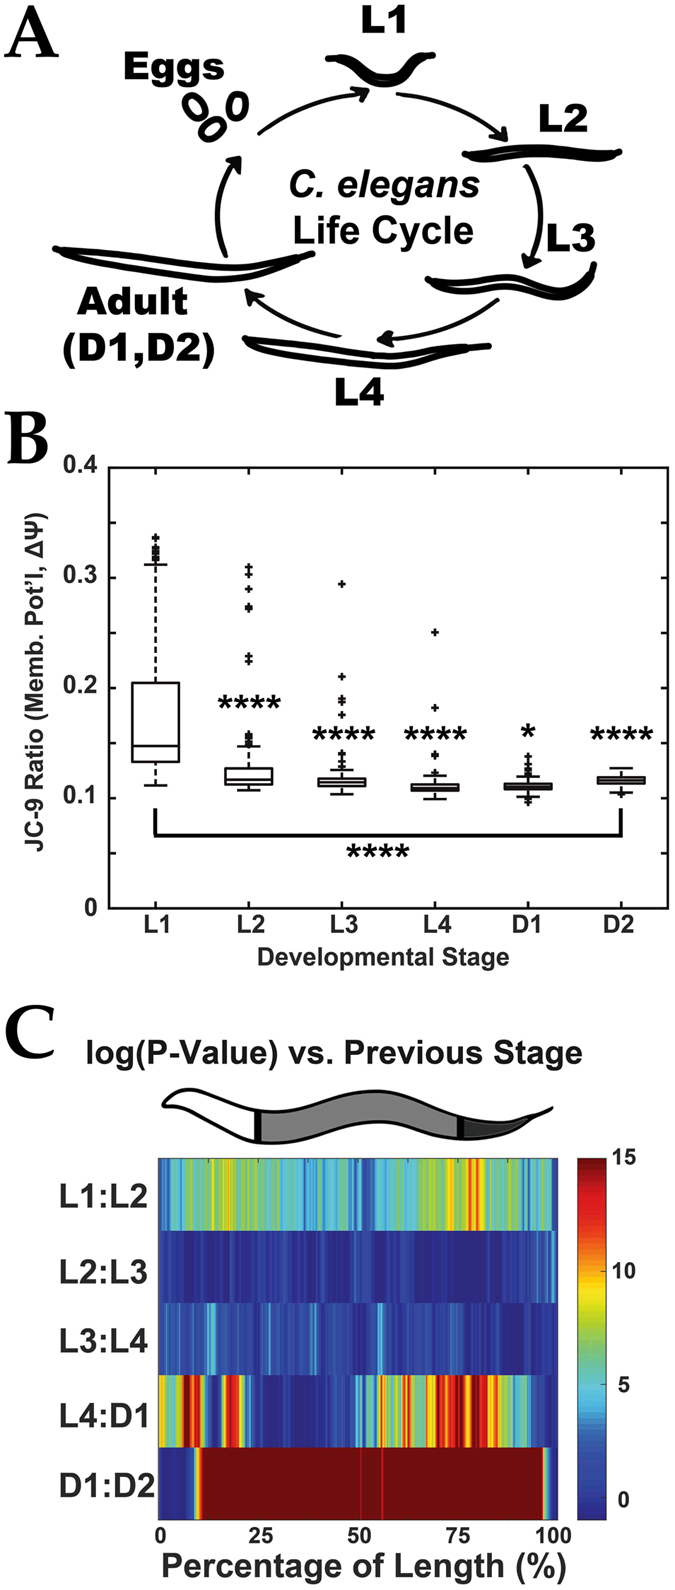
Figure 5.

Mitochondrial membrane potential (Δψ) measurement during early C. elegans development. (A) Schematic of C. elegans life cycle to illustrate size and morphology differences. (B) Quantification of Δψ (by JC9–9 ratio) from live nematodes labeled with JC-9 at various stages of development. *P < 0.05, ****P < 0.00001. (C) Significance (log(P-value)) plots derived from median profiles in Figure S5H comparing each profile to its previous stage (e.g. L1–L2). For significance plots a value ≥ 0 is equivalent to P ≤ 0.05 by Wilcoxon Rank Sum Test. Plots are representative of three biological replicates and derived from n ≥ 50 organisms. Sample size (n) for all experiments and exact P-values can be found in the Supplementary Table. L.A. Daniele provided the illustrations for Part A originally published in: Daniele, J. R., Heydari, K., Arriaga, E. A. & Dillin, A. Identification and Characterization of Mitochondrial Subtypes in Caenorhabditis elegans via Analysis of Individual Mitochondria by Flow Cytometry. Anal. Chem. 88, 6309–6316 (2016)11.
