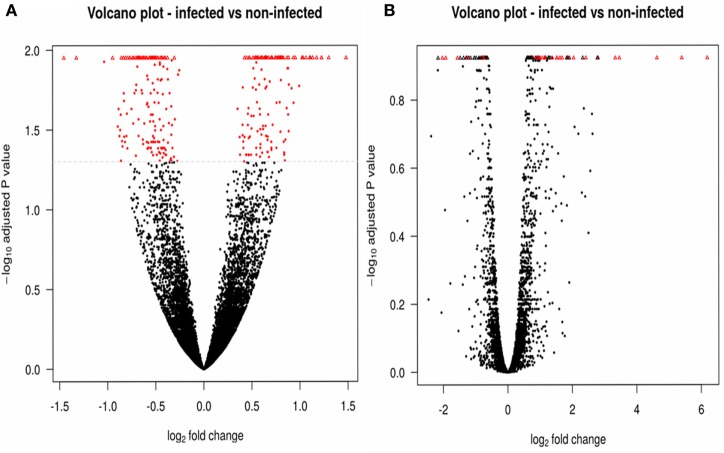
Figure 2.
Comparisons of significantly differentially expressed genes. DESeq2 (A) and edgeR (B) results are illustrated by volcano plots, in which the differentially expressed features are shown in red. Upregulated genes are thus observed as positive values, and downregulated genes as negative values. Triangles correspond to features where the log of the adjusted p-value is too low or too high to be displayed on the plot.

