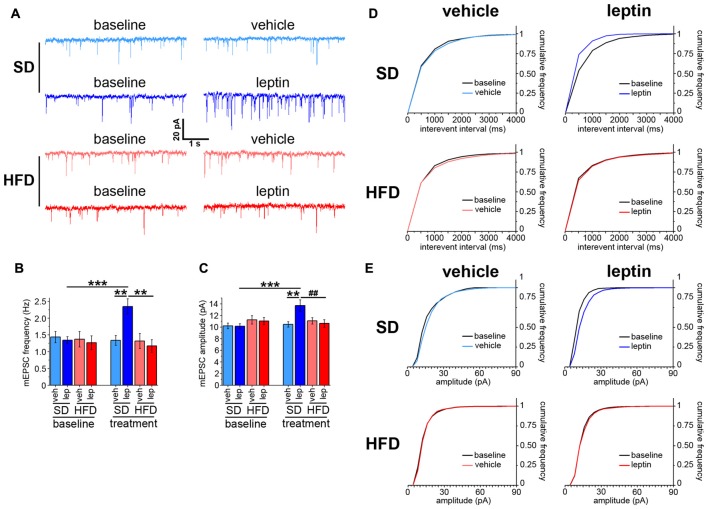
Figure 1.
Leptin modulates spontaneous neurotransmitter release in standard diet (SD), but not in high-fat diet (HFD), mice. (A) Representative traces showing miniature excitatory postsynaptic current (mEPSC) recordings in SD and HFD mice treated with vehicle or leptin; both baseline and post-treatment (i.e., vehicle or leptin) recordings, corresponding to the same cell, are shown. (B) mEPSC frequency is increased in SD mice in response to leptin application; in contrast, HFD mice are resistant to this effect (SD-veh n = 13, SD-lep n = 11, HFD-veh n = 11, HFD-lep n = 14; analysis of variance (ANOVA)-2 diet × treatment interaction p = 0.009, followed by Bonferroni post hoc test, **p = 0.002, ***p < 0.001). (C) SD mice display higher mEPSC amplitude in response to leptin application, whereas HFD mice fail to respond to the treatment (SD-veh n = 13, SD-lep n = 11, HFD-veh n = 11, HFD-lep n = 14; ANOVA-2, diet × treatment interaction, p = 0.007, followed by Bonferroni post hoc test, ##p = 0.006, **p = 0.005, ***p < 0.001). (D) Cumulative frequency distributions for mEPSC interevent intervals, showing a leftwards shift for SD-lep mice (blue curve, upper right panel, Kolmogorov-Smirnov test, p = 0.035) in contrast to no shift in HFD-lep mice (red curve, lower right panel, Kolmogorov-Smirnov test, p = 0.95). (E) Cumulative frequency distributions for mEPSC amplitude, showing a rightwards shift for SD-lep mice (blue curve, upper right panel, Kolmogorov-Smirnov test, p = 0.01) in contrast to no shift in HFD-lep mice (red curve, lower right panel, Kolmogorov-Smirnov test, p = 0.42).

