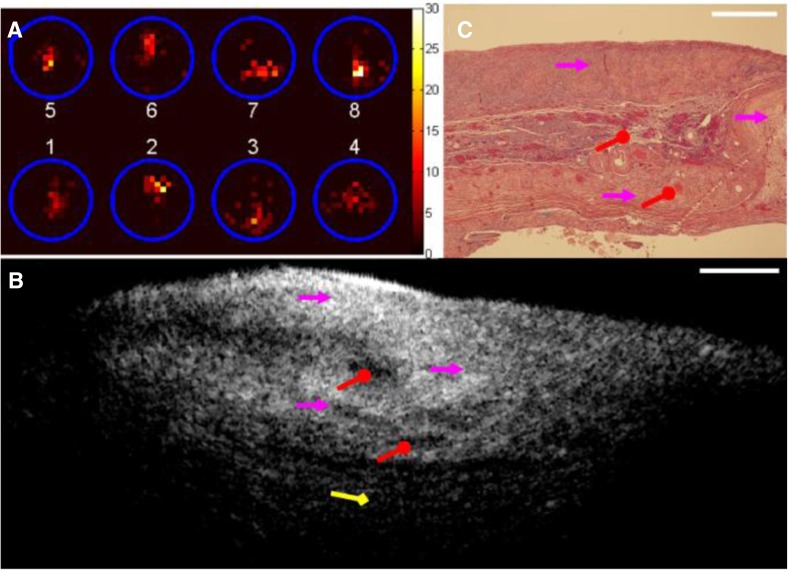
Fig. 5.
One set of images obtained from the right ovary (abnormal) of a patient. a Positron distribution map; b one representative OCT image obtained from a sequence of co-registered OCT images; c corresponding 40× H&E histology. Red circle corpus albicans; red arrow collagen; purple arrow congested vessels; yellow arrow dermoid tumour. The OCT image size is 2 mm (depth) × 5 mm (lateral) (height × width); the histology size is 2 mm × 2.6 mm (height × width); the white scale bar is 0.5 mm
(Figure reproduced with permission from [87])

