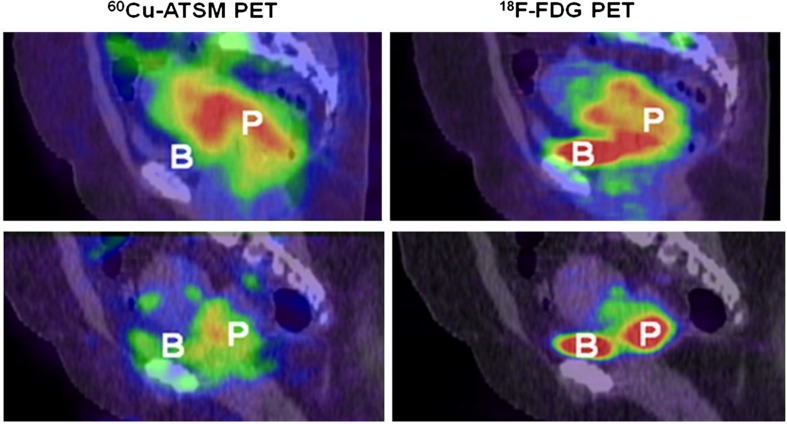
Fig. 1.
Comparison of 60CU-ATSM and 18F-FDG uptake in a hypoxic and normoxic cervix tumor. Upper hypoxic tumor. Sagittal 18F-FDG PET/CT image (right) of pelvis, showing high 18F-FDG uptake in tumor. Sagittal 60Cu-ATSM PET image coregistered with CT image (left) at same level, also showing high tumor uptake of this tracer (T/M = 4.5). Lower normoxic tumor. Sagittal 18F-FDG PET/CT image (right) of pelvis, showing high 18F-FDG uptake in tumor. Sagittal 60Cu-ATSM PET image coregistered with CT image (left) at same level, showing only mildly increased tumor uptake of this tracer (T/M = 3.0). Note that there are different patterns of 18F-FDG and 60Cu-ATSM uptake in both tumors. P tumor, B bladder. This research was originally published in JNM [62]. © by the Society of Nuclear Medicine and Molecular Imaging, Inc

