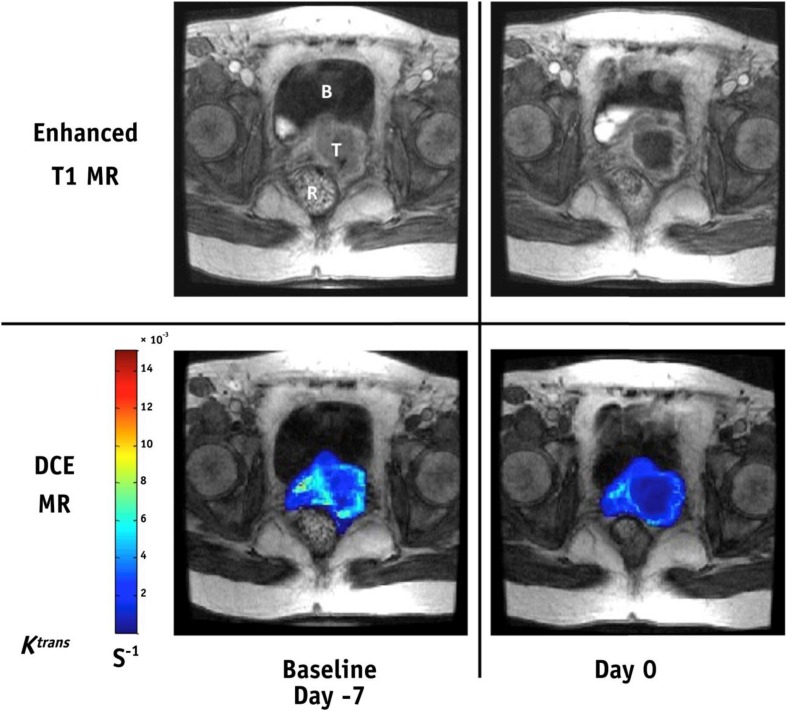
Fig. 3.
Changes in cervix tumor hypoxia by the angiogenesis inhibitor sorafenib, assessed by DCE-MRI parameter Ktrans. Late-phase axial DCE-MR T1 image of pelvis (upper) and the corresponding tumor Ktrans maps (lower) superimposed on the late-phase DCE-MR T1 image at baseline before any treatment (day −7; left) and after 7 days of sorafenib alone (day 0; right). Note the decrease in Ktrans after sorafenib treatment. B bladder, R rectum, T tumor
Reproduced with permission from Milosevic et al. [8]

