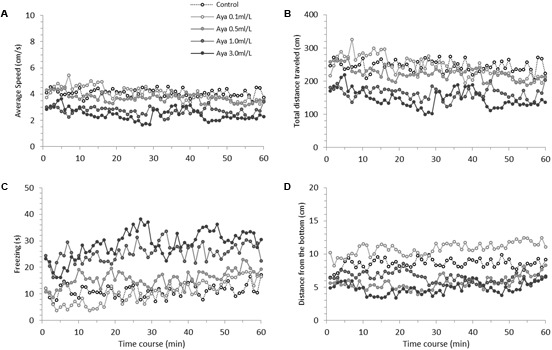
FIGURE 1.

Time-course behavioral changes during 60-min Ayahuasca exposure in zebrafish. (A) Average swimming speed, (B) Total distance traveled, (C) Freezing and (D) Distance from the bottom of the tank. (A,B) Indicate locomotion parameters, (C,D) indicate anxiety-like behavior parameters. The Ayahuasca doses are shown in above graph (A). Sample sizes (n) were 14 for each dose. For statistical analysis see Results and Table 1.
