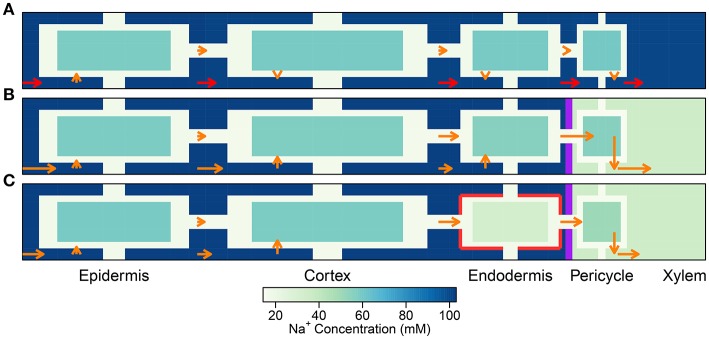
Figure 4.
Plots of steady-state Na+ fluxes (arrows) and Na+ concentrations (color maps) at a point halfway along the differentiation zone (j = 28), for a uniform distribution of transporters and three different root structures: (A) no endodermal barriers present, (B) CS present, and (C) CS and SL present. Purple (red) lines show the location of the CS (SL). Arrows indicate relative flux magnitudes via the apoplast, symplast, and across the cell plasma membranes (for clarity, axial fluxes are not displayed). Orange arrows are drawn to the same scale across all three subfigures. Red arrows represent 100 times larger fluxes relative to the orange arrows. Na+ concentrations are shown for all three compartments (apoplast, cytoplasm, and vacuole), although the latter are not drawn to scale (different scale to Figure 3). The simulation conditions are as described in Figure 3.

