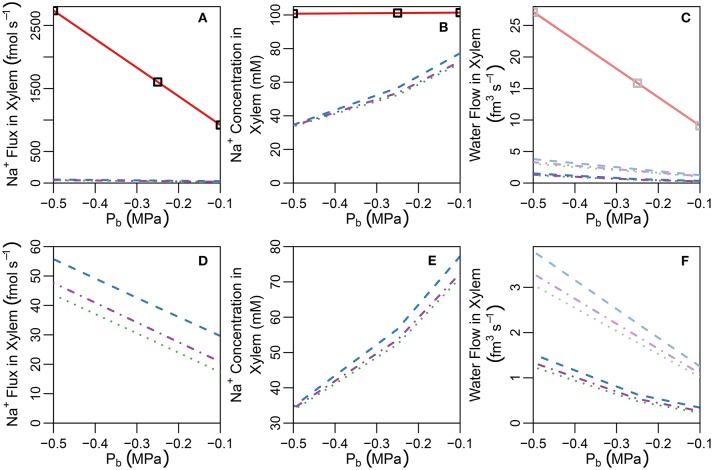
Figure 5.
Plots of steady-state (A) Na+ concentrations, (B) Na+ fluxes, and (C) water flow rates, in the transpiration stream at the top of the root under pre-salt (light lines) and salt stress (dark lines) conditions, as a function of Pb for a uniform distribution of transporters and five different root structures (see also Figure S3). Panels (D–F) show the same information as (A–C), respectively, excluding the no endodermal barrier scenario to highlight the effects of the SL. Line types refer to root structure: solid red lines ≡ no endodermal barriers (as shown in Figure 3A); dashed blue lines ≡ CS only; dotted green lines ≡ CS and a continuous, uninterrupted SL; and dot-dashed purple lines ≡ CS and SL with passage cells (as shown in Figure 3B). Squares represent the SL-only case (corresponding to the root structure shown in Figure S10B). The simulation conditions are as described in Sections 3.3 and 3.4, as well as Tables S1, S2.

