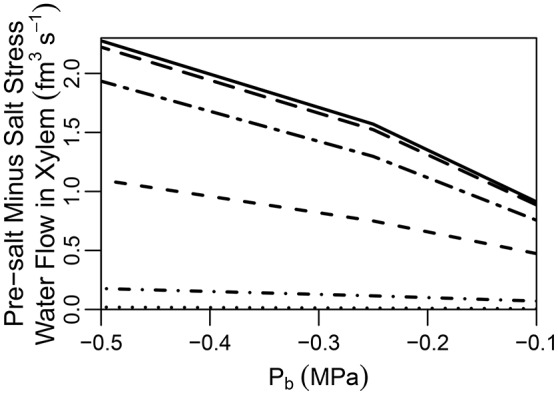
Figure 6.

Plot of steady-state pre-salt minus salt stress water flow rates in the transpiration stream at the top of the root, as a function of Pb for CSs with a range of permeabilities. Line types indicate CS effectiveness: no CS present (dotted lines); and reduced by one order of magnitude (short dot-dashed lines); and reduced by two orders of magnitude (short dashed lines); and reduced by three orders of magnitude (long dot-dashed lines); and reduced by four orders of magnitude (long dashed lines); a completely impermeable CS (solid lines). The SL were excluded from all simulations. The remaining transport parameters and boundary conditions are as described in Sections 3.3 and 3.4, as well as Tables S1, S2.
