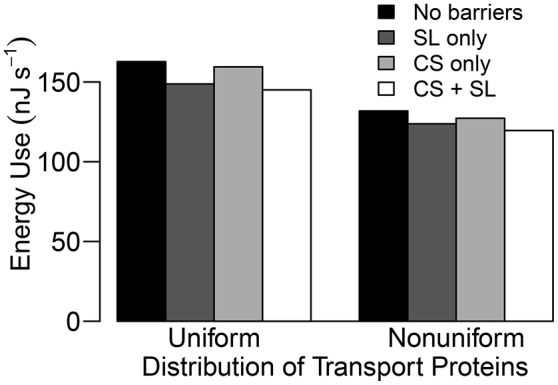
Figure 9.

Steady state energy use histograms for a uniform and a non-uniform distribution of transporters as described in Section 3.4 for four different root structures: no endodermal barriers (black); SL only (dark gray); CS only (light gray); CS and SL present (white). Energy use is estimated by the energy released from hydrolysis of ATP (approximately 54.8 kJ per mole of ATP hydrolyzed (Schmidt and Briskin, 1993) and hence, 54.8 kJ per mole of H+ pumped across the plasma membranes) and hydrolysis of PPi (≈24.9 kJ per mole of H+ pumped across the tonoplasts, Schmidt and Briskin, 1993). This is a measure of the energy used to pump H+ which cannot then be used by the plant for other processes. Qualitatively identical results are obtained if the total steady state flux of H+ via all pumps is used as a proxy for energy use. Simulations were conducted using Pb = −0.5 MPa with remaining conditions and parameters as described in Sections 3.3 and 3.4, as well as Table 1 and Tables S1, S2.
