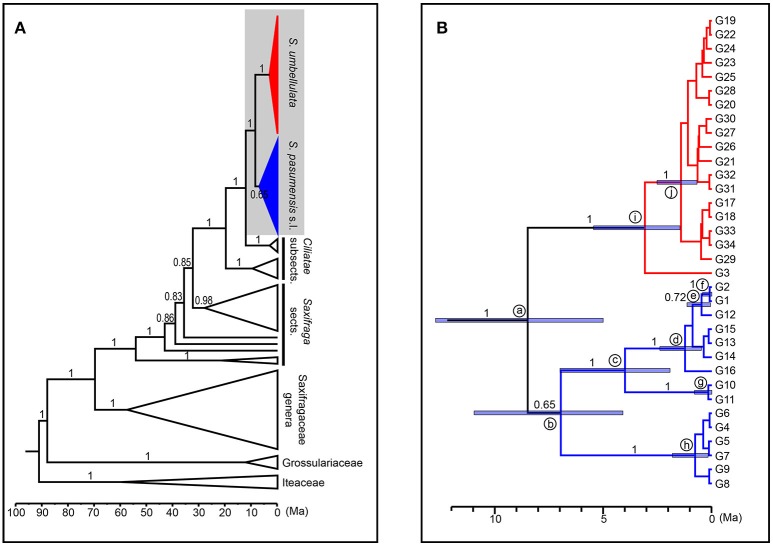
Figure 5.
Maximum clade credibility tree and divergence time estimation based on ITS genotypes of Saxifraga pasumensis s.l. and S. umbellulata. (A) Profile of time estimation results including all outgroups. (B) Enlargement of the shadowed area, which represents ITS genotypes of S. pasumensis s.l. and S. umbellulata. Blue bars represent 95% highest posterior density. Numbers on the branches are values of posterior probabilities.

