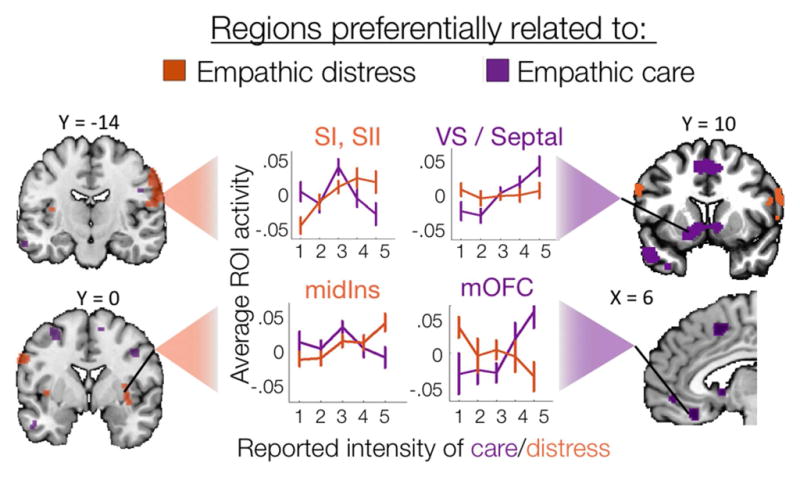
Figure 4.

Regions identified in previous analyses (see Figure 3) as sensitive and specific to empathic care or distress show the expected pattern of response across emotion intensity levels. Plots depict ROI-average activity across increasing intensity levels of care (purple) and distress (orange) (1 = lowest intensity, 5 = highest intensity, mean ± 95% CIs).
