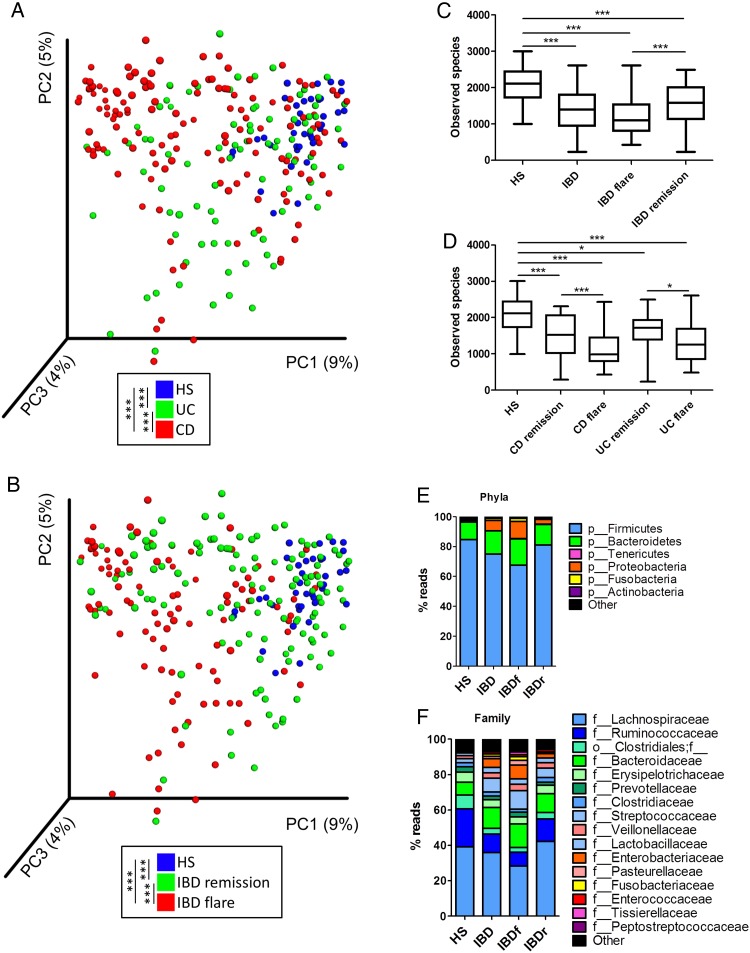
Figure 1.
Altered bacterial microbiota biodiversity and composition in IBD. (A and B) Beta diversity. Principal coordinate analysis of Bray–Curtis distance with each sample coloured according to the disease phenotype. PC1, PC2 and PC3 represent the top three principal coordinates that captured most of the diversity. The fraction of diversity captured by the coordinate is given as a percentage. Groups were compared using Permanova method. (C and D) Observed species number describing the alpha diversity of the bacterial microbiota in the various groups studied (Kruskal–Wallis test with Dunn's multiple comparison test). (E and F) Global composition of bacterial microbiota at the phyla and family levels. Healthy subjects (HS) and patient subgroups are labelled on the x-axis and expressed as the relative operational taxonomic unit (OTUs) abundance for each group. In all panels: *p<0.05; **p<0.01; ***p<0.001. CD, Crohn's disease.

