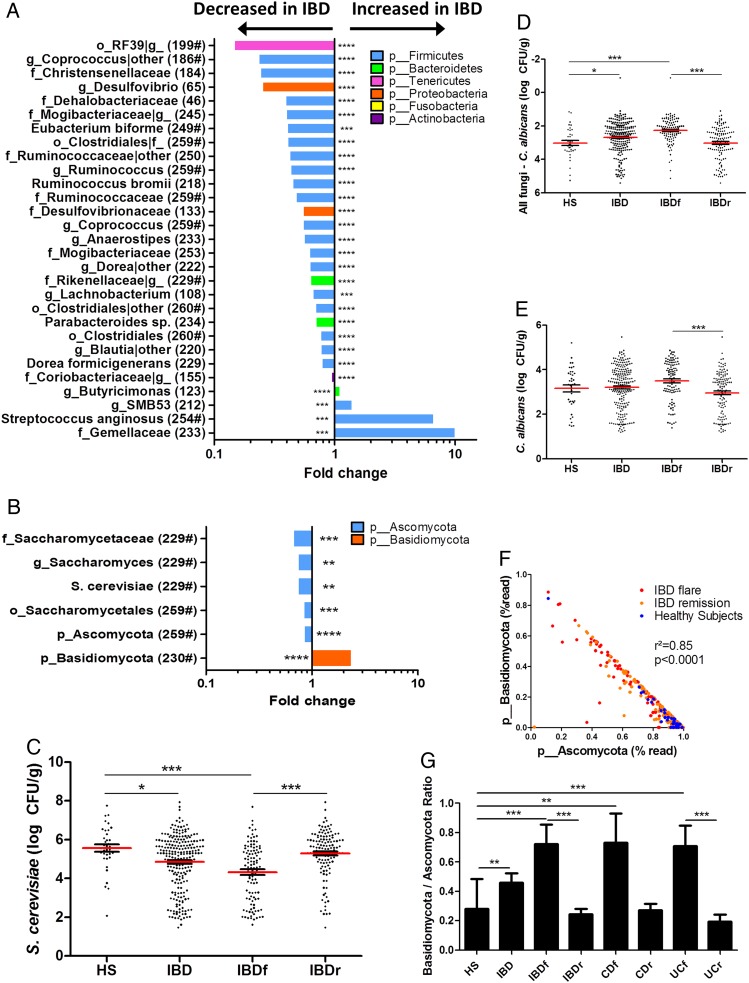
Figure 3.
Bacterial and fungal taxa associated with IBD. (A and B) Differences in abundance are shown for the bacterial and fungal taxa detected using a multivariate statistical approach (see ‘Material and Methods’). The fold change for each taxon was calculated by dividing the mean abundance in the cases by that of the controls. The number of subjects that have any presence (>0) of the indicated taxon is indicated in brackets, and taxon with a mean abundance of >0.5% in at least one of the groups is indicated with ‘#’. (C) Absolute Saccharomyces cerevisiae abundance in the faecal microbiota quantified using qRT-PCR (mean±SEM). (D) Relative proportion of Candida albicans calculated by subtracting the log number of C. albicans from the log number of all fungi. (E) Absolute C. albicans abundance in the faecal microbiota quantified using qRT-PCR (mean±SEM). (F) Basidiomycota/Ascomycota relative abundance ratio in the various groups studied (Kruskal–Wallis test with Dunn's multiple comparison test, *p<0.05; **p<0.01; ***p<0.001; ****p<0.0001). CD, Crohn's disease; HS, healthy subjects.

