
Figure 3.
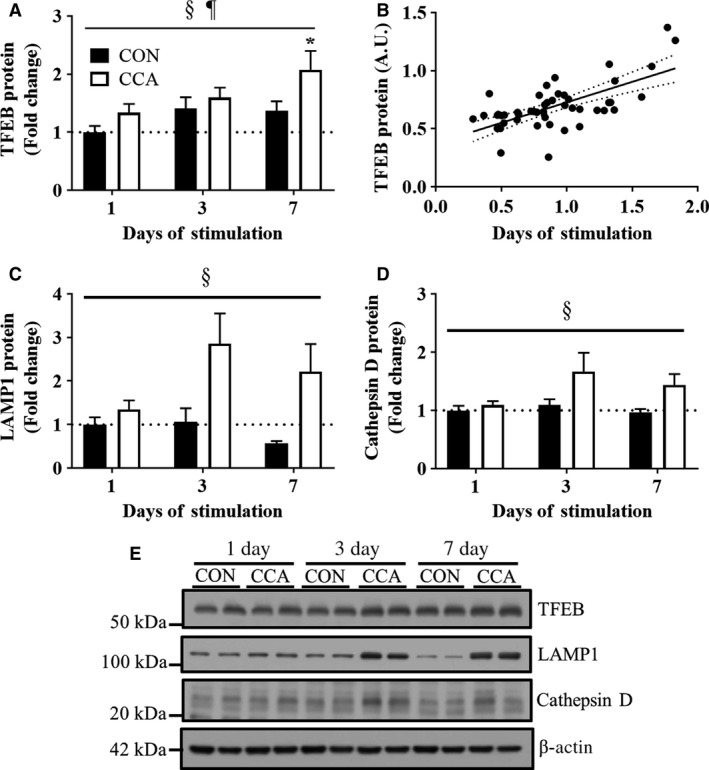
Lysosomal protein alterations during muscle adaptations. Fold‐change in the protein expression of lysosomal system markers (A) TFEB, (C) LAMP1, and (D) Cathepsin D (n = 8 per group). The protein levels in Cathepsin D show only the mature forms (~33 kDa). (B) Pearson's correlation between TFEB and PGC‐1α proteins (n = 48 per protein; P < 0.05). (E) Representative blots for TFEB, LAMP1, and Cathepsin D. β‐actin was used for loading control. All bars are shown as fold‐change relative to the control group at Day 1, and they represent means ± SEM. §P < 0.05, main effect of CCA; ¶P < 0.05, main effect of time; *P < 0.05, significant difference versus control at Day 1.