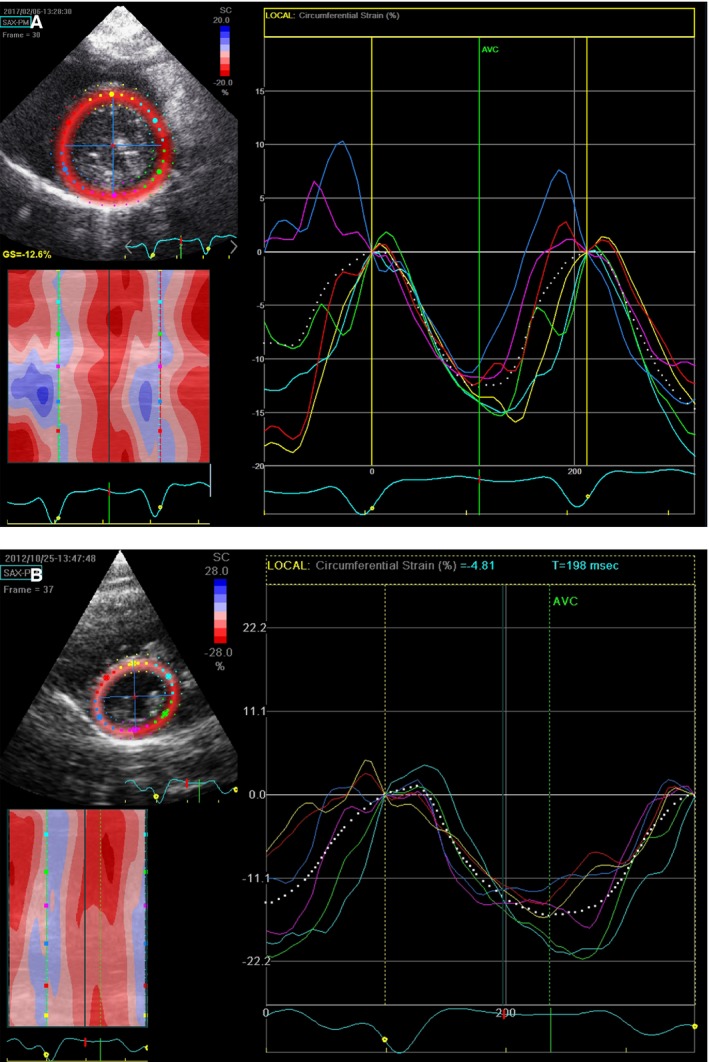
Figure 1.

Example of left ventricular (LV) circumferential regional strain in a sham (A) and a PAB (B) rabbit. Depicted are regional LV strain curves. Each strain curve is coded in a color corresponding to the region color‐coded on the short‐axis reference image. Circumferential strain depicts the phasic myocardial shortening (negative portion of the curve) and lengthening (return of the curve to baseline) around the circumference of the LV. The percent shortening is expressed relative to the baseline end‐diastolic length. Note the low global (average of 6‐regional segments) depicted as a white dotted line) LV circumferential strain caused by the low regional strain in the septal, septal hinge‐point and inferior left ventricular regions (cyan, yellow, red and pink curves) in the PAB rabbit.
