Figure 2.

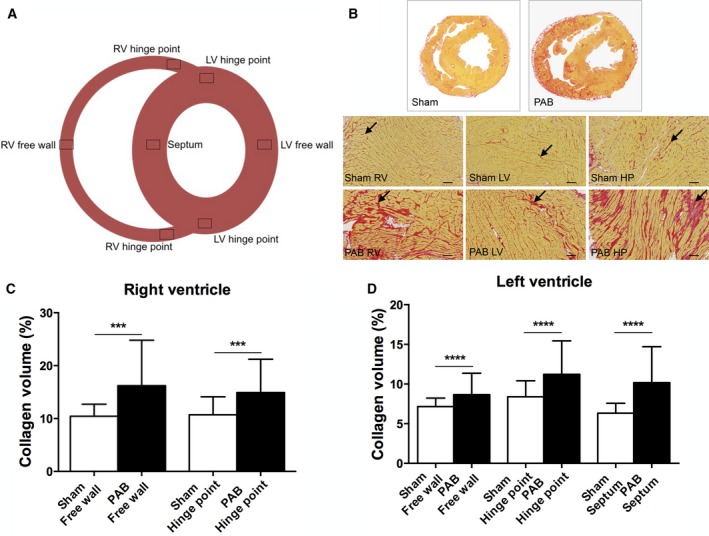
Fibrosis assessed as collagen content percent of the total myocardium in PAB rabbits. (A) Short‐axis diagram depicting the cardiac regions analyzed for collagen content. (B) Picro‐sirius red stained histologic samples of the right and left ventricular free walls. Scale bars: 100 μm, magnification ×100. Higher collagen deposition, indicated by red staining (arrows), is apparent in the right ventricle of PAB animals. Panels (C and D) show right and left ventricular collagen content quantification. (C) There is significantly more fibrosis in the right ventricular free wall and hinge‐point region compared to shams, *P < 0.001. (D) There is significantly more left ventricular regional fibrosis in the free wall, hinge‐point regions and septum compared to shams, *P < 0.0001. The hinge point regions from the anterior and posterior region are analyzed together in each ventricle. Data are presented as mean (SD), Sham: n = 6, PAB: n = 14. RV, right ventricle and LV, left ventricle.
