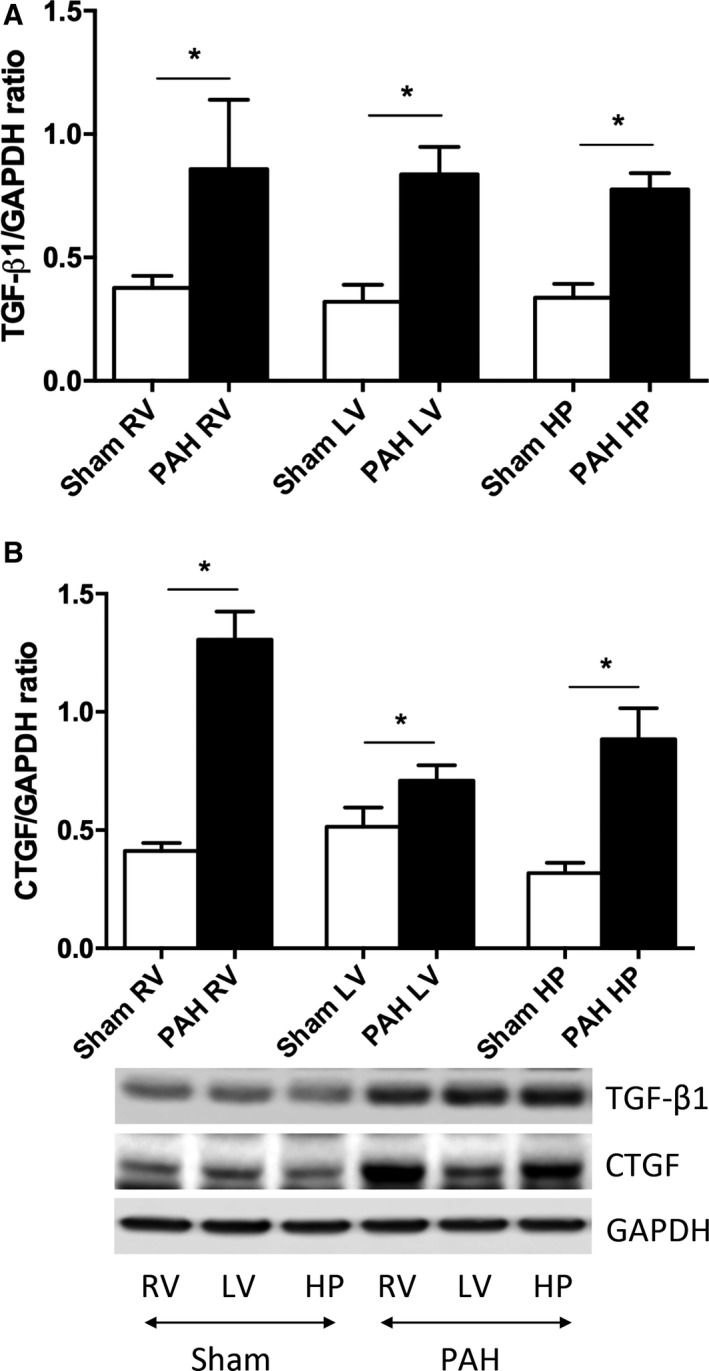
Figure 4.

Regional TGF‐β1 and CTGF protein levels in PAH rats from the right and left ventricular free wall and septal hinge‐point regions (right and left ventricular septal hinge‐point regions were analyzed together). TGF‐β1 protein level increased with PAH in the RV, LV, and the hinge‐point region (HP) compared with shams. CTGF protein level showed the same pattern; the most extensive increase in CTGF in the RV, but also in the LV and hinge‐point region (HP) compared with shams. (Sham: n = 4 and PAH: n = 4). Data are presented as mean (SD), *P < 0.05. RV, right ventricle and LV, left ventricle.
