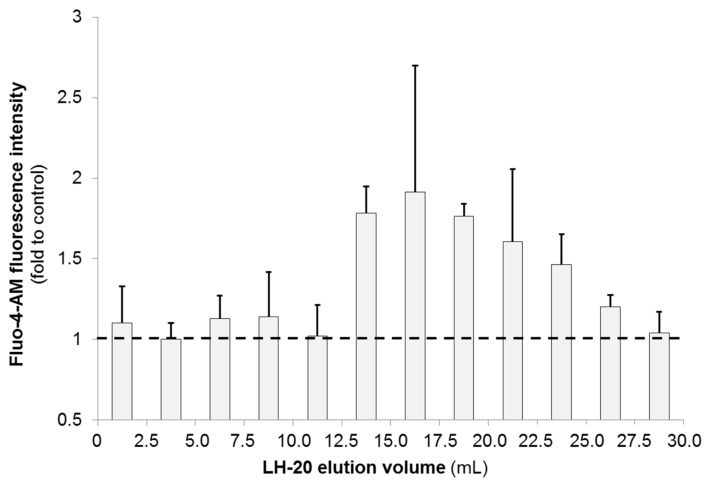
Figure 3.
Calcium (Ca2+) influx into N2a cells induced by LH-20 fractions of G. excentricus VGO791 (MSF sample). Ca2+ flux was measured using fluorescence of Fluo-4-AM (488 nm). Fluo-4-AM fluorescence was expressed as a fold of intensity compared to the control wells (horizontal dashed line). Error bars represent assay variability (standard deviation, SD) measured by running extracts in three separate assays. In each assay, three separate wells were used for assaying each fraction. Ca2+ influx was observed only in LH-20 fractions corresponding to an elution volume (Ve) of 12.5–27.5 mL. Fractions eluting after a Ve of 30 mL were omitted because they exhibited no MTX-induced fluorescence changes.

