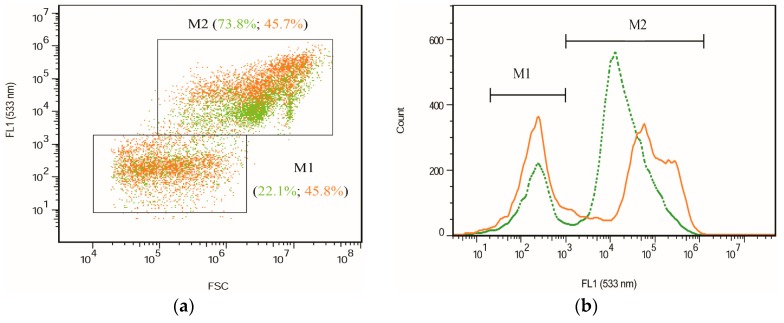
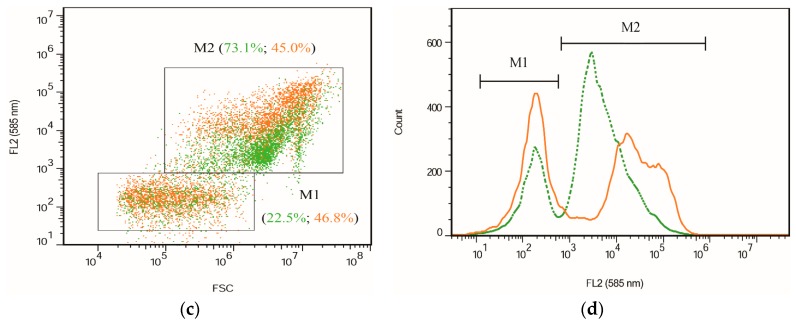
Figure 8.
The cytograms of mixotrophic C. zofingiensis during cultivation based on FCM analysis. (a) FSC vs. FL1; (b) Cell count vs. FL1 (533 nm ± 15 nm); (c) FSC vs. FL2; and (d) Cell count vs. FL2 (585 nm ± 20 nm). Green dotted lines (or dots) represent the initial cells (the start of culture); orange solid lines (or dots) represent the final cells (the end of culture). M1 represents the population of small cells with low fluorescence; M2 corresponds to the population of large cells with high fluorescence.


