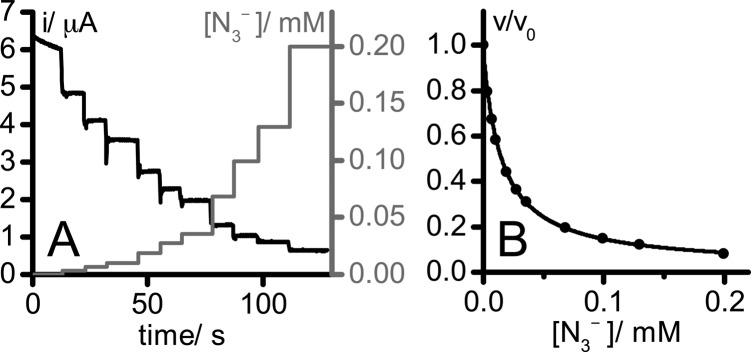
Figure 2.
(A) Chronoamperometry trace recorded at −0.1 V vs SHE in 5 mM aqueous sodium formate solution (pH 7, 23.5 °C, electrode rotation rate 2000 rpm). Aliquots of a 15 mM solution of NaN3 (also containing 5 mM formate) were added to adjust the N3– concentration (right axis). pH and substrate concentration were constant throughout, and the data were corrected for film loss.36 (B) Dependence of the normalized current (v/v0, current observed at the given inhibitor concentration divided by the current observed in the absence of inhibitor) on NaN3 concentration, derived from the data in panel A. The data were fit using the standard dose–effect relationship, namely, v/v0 = 1 – {[N3–]/(IC50 + [N3–])}, with a Hill coefficient of 1.

