
Figure 6. Pax2 function in cap mesenchyme cells is required cell-autonomously to repress transdifferentiation into renal interstitial cells at a later stage of kidney development.
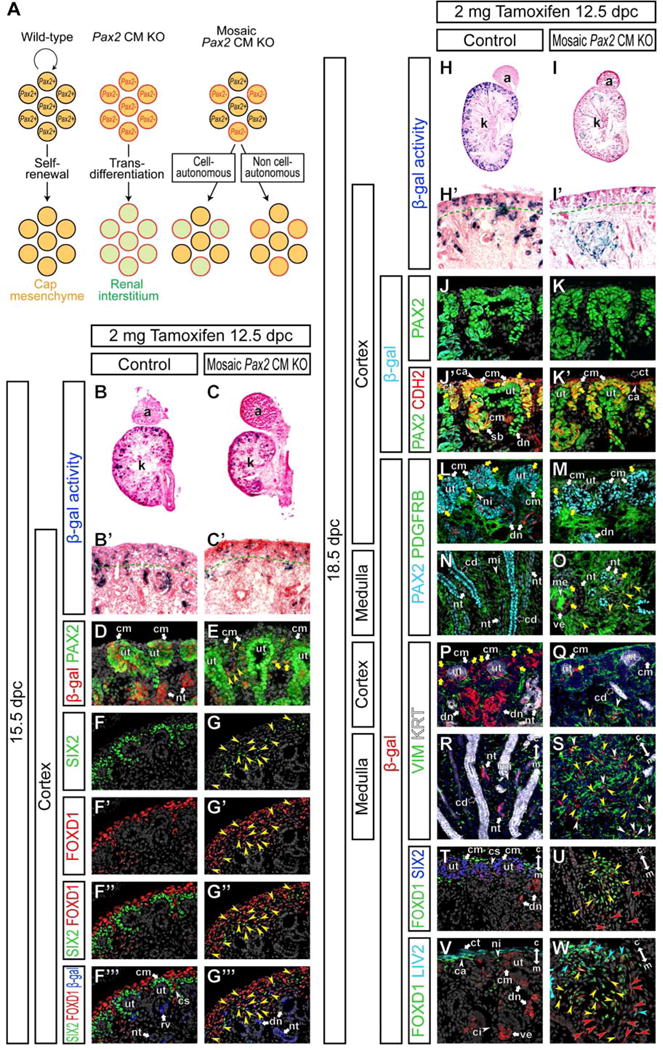
(A) Schematic illustration of mosaic analysis for Pax2 function in cap mesenchyme cells. In wild-type kidneys, Pax2 wild-type (black perimeter) cap mesenchyme cells (orange fill) can self-renew. Pax2-deficient (red perimeter) cap mesenchyme cells transdifferentiate into renal interstitial cell types (green fill) in the Pax2 CM mutants. In mosaic cap mesenchyme-specific Pax2 (mosaic Pax2 CM) mutants, some cap mesenchyme cells remain Pax2+, while the others become Pax2−. If Pax2 function is cell-autonomously required to repress renal interstitial cell fates (1), Pax2− cells will transdifferentiate into renal interstitial cells and may become excluded from the cap mesenchyme. If Pax2 function is required non cell-autonomously by regulating secreted factors or membrane-bound molecules signaling extracellularly (2), defects in Pax2− cells will be compensated by surrounding Pax2+ cells. Therefore, Pax2− cells will be able to remain as cap mesenchyme cells. (B–W) Kidneys from Six2eGFPCreERT2/+; Pax2flox/+; R26RlacZ/+ control mice (Control) and Six2eGFPCreERT2/+; Pax2flox/del; R26RlacZ/+ mosaic cap mesenchyme-specific Pax2 mutant mice (Mosaic Pax2 CM KO) after injection of 2 mg of tamoxifen into dams at 12.5 dpc. (B and C) X-gal (blue) stained section counter-stained with eosin (pink) at 15.5 dpc. (B′ and C′) High magnification of cortical regions in B and C, respectively. Green dotted lines indicate the boundary between the nephrogenic zone and renal cortex. (D and E) Confocal immunofluorescence of the cortical region of the kidney at 15.5 dpc with β-gal (cap mesenchyme-derived cells; red), PAX2 (green) and Hoechst (nucleus; gray) staining. Yellow arrowheads and yellow arrows in E indicate β-gal+ cells with reduced and normal PAX2 expression levels, respectively. (F–G‴) Confocal immunofluorescence of the cortical region of the kidney at 15.5 dpc with SIX2 (green), FOXD1 (red), β-gal (cap mesenchyme-derived cells; blue) and Hoechst (nucleus; gray) staining. Yellow arrowheads indicate SIX2+ FOXD1+ β-gal+ cells. (H and I) X-gal (blue) stained sections counter-stained with eosin (pink) at 18.5 dpc. (H′ and I′) High magnification of cortical regions in H and I, respectively. Green dotted lines indicate the boundary between the nephrogenic zone and renal cortex. (J–W) Confocal immunofluorescence of the kidney at 18.5 dpc with β-gal (cap mesenchyme-derived cells; cyan in J–K′ and red in L–W) and Hoechst (nucleus; gray in J–O,T–W and blue in P–S) staining. (J–K′) The cortical region with PAX2 (green) and N-cadherin (CDH2; red) staining. Yellow arrows in J′,K′ indicate β-gal+ PAX2+ cells in the CDH2+ cap mesenchyme. (L–O) The cortical (L,M) and medullary (N,O) regions with PAX2 (cyan) and PDGFRB (green) staining. Yellow arrows in L,M indicate β-gal+ PAX2+ cells in the cap mesenchyme. Yellow arrowheads and yellow arrows in O indicate β-gal+ PDGFRB+ cells and β-gal+ cells in the nephron epithelium, respectively. (P–S) The cortical (P,Q) and medullary (R,S) regions with VIM (green) and cytokeratin (KRT; white) staining. Yellow arrows in P,Q, yellow arrowheads and white arrowheads in Q,S indicate β-gal+ cells in the cap mesenchyme, and β-gal+ VIM− and β-gal+ VIM+ cells in interstitial aggregates in mosaic Pax2 CM mutants, respectively. (T–W) Cortical regions (T,V) and interstitial aggregates (U,W) with FOXD1 (green) and SIX2 (blue) (T,U) or LIV2 (cyan) (V,W) staining. Yellow arrowheads in U, β-gal+ FOXD1+ cells; red arrowheads in U, β-gal+ FOXD1− cells. Cyan arrowheads in W, β-gal+ FOXD1+ LIV2+ cells; yellow arrowheads in W; β-gal+ FOXD1+ LIV2− cells; red arrowheads in W, β-gal+ FOXD1− LIV2− cells. Double arrows in R–W indicate the cortico-medullary axis of the kidney. Abbreviations as in Figure 2 and cs, renal cortical stroma.