
Figure 7. Gene expression profiles for Pax2-mutant cap mesenchyme-derived cells are similar to those in renal interstitial cells than nephron epithelial cells, but distinct.
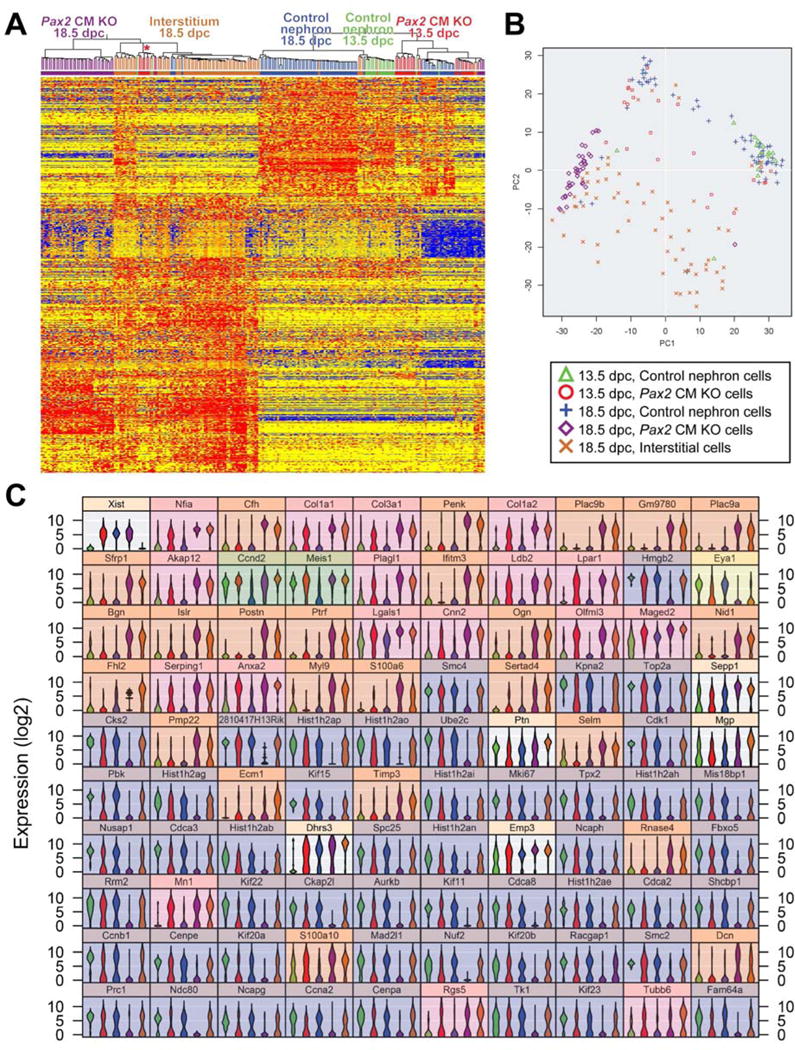
(A) Heat map and unsupervised hierarchical clustering by GeneSpring for single cell RNA-seq analysis of Pax2-mutant cap mesenchyme-derived cells in Six2-eGFPCretg/+; Pax2flox/del; R26R-CAGGStdTomato/+ mutant kidneys at 13.5 and 18.5 dpc, control nephron cells from Six2-eGFPCretg/+; Pax2flox/+; R26R-CAGGStdTomato/+ kidneys at 13.5 and 18.5 dpc and renal interstitial cells from Foxd1eGFPCreERT2/+; Pax2flox/+; R26R-CAGGStdTomato/+ kidneys at 18.5 dpc following 2 mg tamoxifen injection at 11.5 dpc. The red asterisk indicates Pax2 mutant cells expressing interstitial genes at 13.5 dpc. (B) PCA plot by AltAnalyze. (C) Violin plot for the top 100 discriminating genes by AltAnalyze.